Update 1
January 31, 2021
Long Term Ecological Research (LTER) Datasets: R package
Project Sponsor: National Center for Ecological Analysis and Synthesis (NCEAS)
Team Members: Sam Guo, Adhitya Logan, Lia Ran, Sophia Sternberg, Karen Zhao
Goal
Build an R package (and accompanying website) that contains one sample dataset from each of the 28 Long Term Ecological Research (LTER) Network sites, for use in data science education as an alternative to the popular, but controversial, iris dataset.
Background Info
The LTER network is a set of (currently) 27 National Science Foundation-funded research programs to observe long-term and large scale ecological effects at various sites across the United States. LTER datasets are archived in a centralized data repository managed by the Environmental Data Initiative (EDI). Our project sponsor, NCEAS, is an environmental science research center at UC Santa Barbara that operates the LTER Network Office.
Software Tools
Google Drive, Git, Github, RStudio, tidyverse, palmerpenguins, metajam
Progress
Used Gitter for team communication, a chat interface that is linked with Github repositories
Reviewed all 28 LTER sites, each of which contains hundreds of research projects and thousands of interesting real-world environmental datasets
Used Git, Github, and RStudio for project management and collaboration (each of us have different levels of experience with these tools)
Learned the workflow we will be using from our sponsors, Julien and Allison, who gave us mini lessons
Partnered up with each other and practiced the workflow (creating RMarkdown documents, branches, pulls, pushes, code reviews, merges, etc)
Used the tidyverse package for data wrangling and visualization (see next section) of data from the palmerpenguins package (created by Allison)
Been introduced to the metajam R package (created by data scientists fromNCEAS), which is used for downloading and reading metadata
Below are some examples of visualizations we created after exploring the palmerpenguins package.
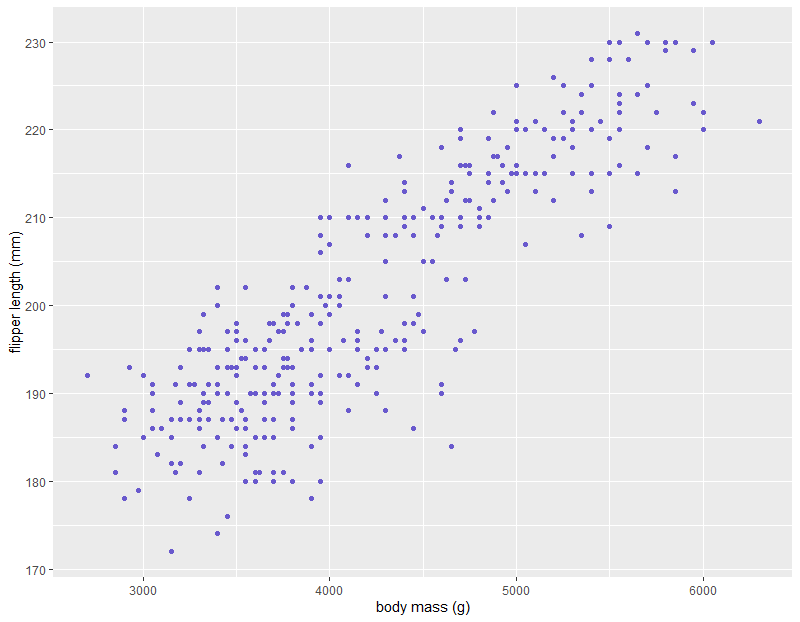
A scatterplot showing the relationship between penguin body mass and flipper length
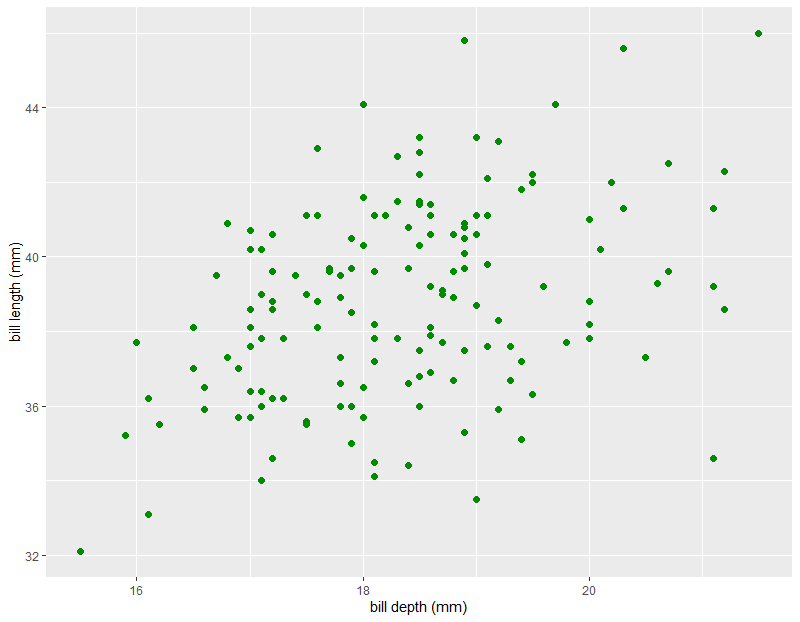
A scatterplot of bill depth versus bill length for Adelie penguins
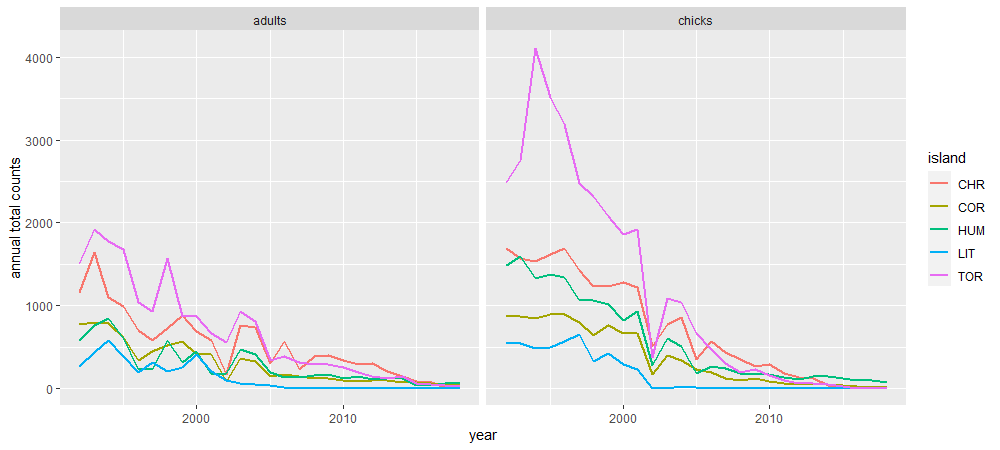
Adelie penguin chick production across years and islands