Update 2
Project Introduction
CALCOFI is an organization tasked with studying the marine environment of coastal California and investigating the relationships between climate, fish population, and other human activities.
Our project focuses on two separate information sets: fish larvae catch data from CALCOFI cruises intended to measure populations of various species, and commercial fish data from fisheries in California.
We are seeking to establish whether any correlation can be drawn from the two datasets, as well as possibly investigate any environmental factors that add variance to the relationship.
Summary of Datasets
Larvae Dataset
A column for times, and one for every species caught
Very sparse dataset, since most of the cruises caught 0 of a particular species
Commercial Fishery Dataset
Columns for time, location, and which species was caught
Species are in common, rather than scientific, names so need to be converted
Also column for total price and pounds caught of fish
However, because of data privacy, much of the price/pounds are redacted (if there were very few cruises that month).
We are investigating whether we can aggregate the data by using coarser spatial resolution in order to get more accurate catch information
Block Grouping Dataset
Contains total price and total pounds caught for each species, by year
Also contains basic information about location of each catch
Part 1: Exploring Correlations
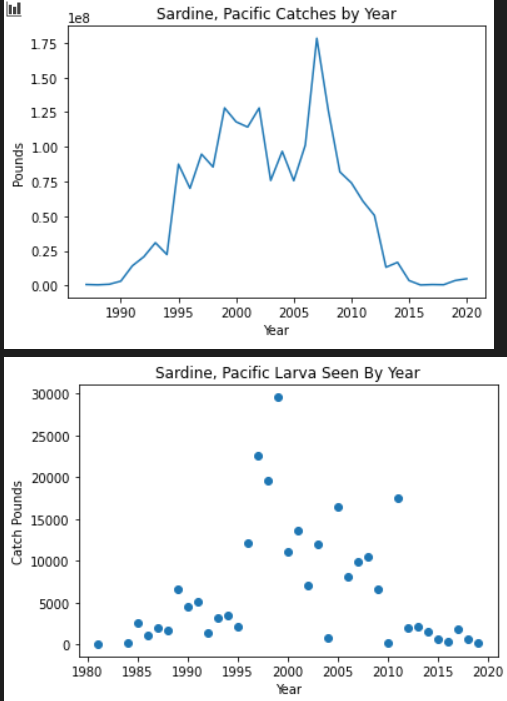
In our last progress update, we took a brief look at the visual relationship between the larvae and the fishery catch. Now that we got more refined data, we noticed strong correlation with certain fish, such as pacific sardine:
At this point, we wanted to explore the possibility of a more causal relationship by offsetting the years between the datasets. This way, it would give us a better look if, for example, a higher larvae count 2-4 years ago could potentially predict a higher fishery catch later. We performed a basic linear correlation on the offset data, generating the following graph:
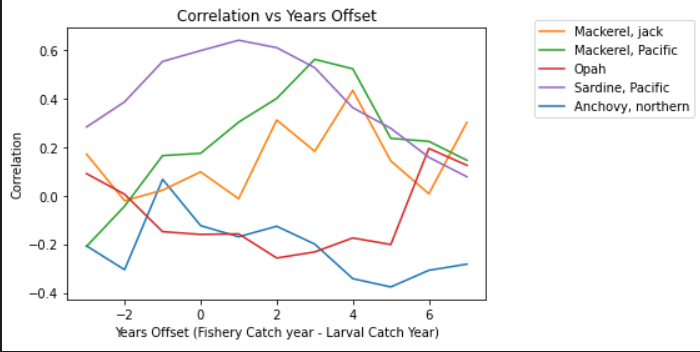
As we can see, several fish (anchovy and opah) hold almost no correlation regardless of the year offset. However, the fish with the highest correlations (both mackarels and the sardine) do seem to have higher correlations when offsetted by several years, around the typical lifespans of the fish.
The logical next steps would be to now explore performing some significance tests between the two correlations to see if they differ by a statistically significant amount, or purely by random chance. Either way, we were quite excited about finding any such relationship in the data, even if it is only moderately strong.
Then, we continued to explore correlations by investigating the following:
a) Price Per Pound vs. Catch Pounds
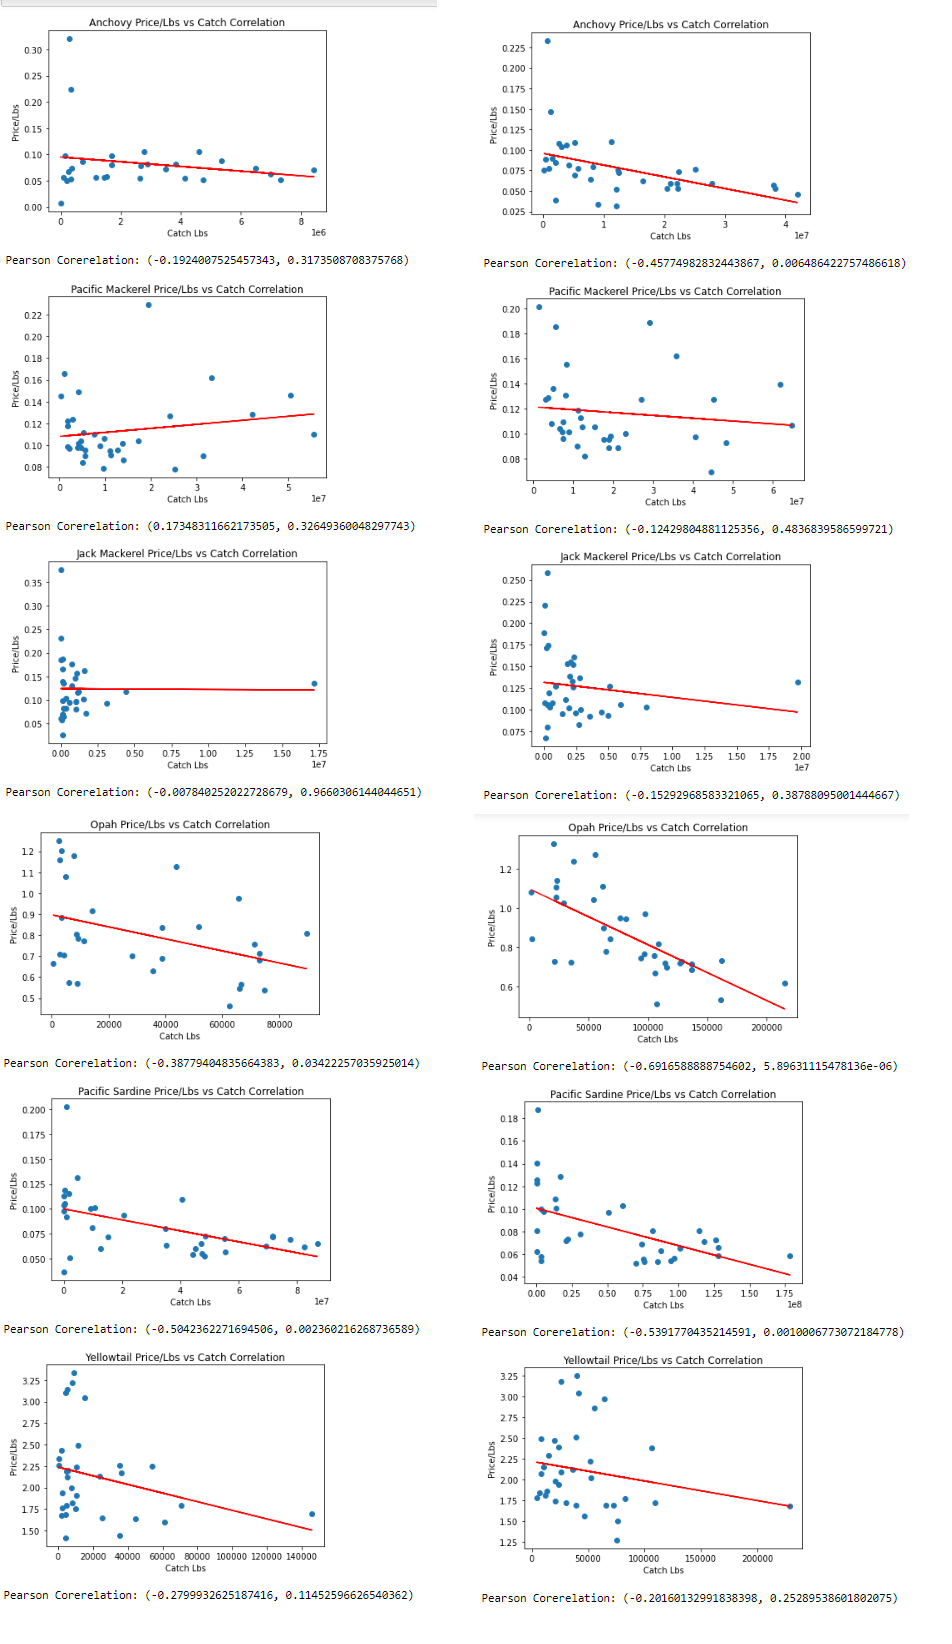
These graphs showcases the correlation between the price/pound of each individual fish compared with how many fish were caught that specific year. In addition, this compares the graphs produced by the old dataset (left) with our new dataset (right), which draws a conclusion that the new dataset showcases a clearer relationship between the two features. The new dataset now reveals that all fish has a negative correlation when comparing price/pound and total catch, with Anchovy, Opah, and Sardine showing that their correlation is significant enough that this did not happen through chance. Thus, we can draw a inference where the more fish that is caught in a singular year, the lower the price of each individual fish is, which is something we couldn’t conclude from the original dataset due to some of the fish showcasing varying relationships and correlations.
b) Total Catch vs. Larvae Amounts
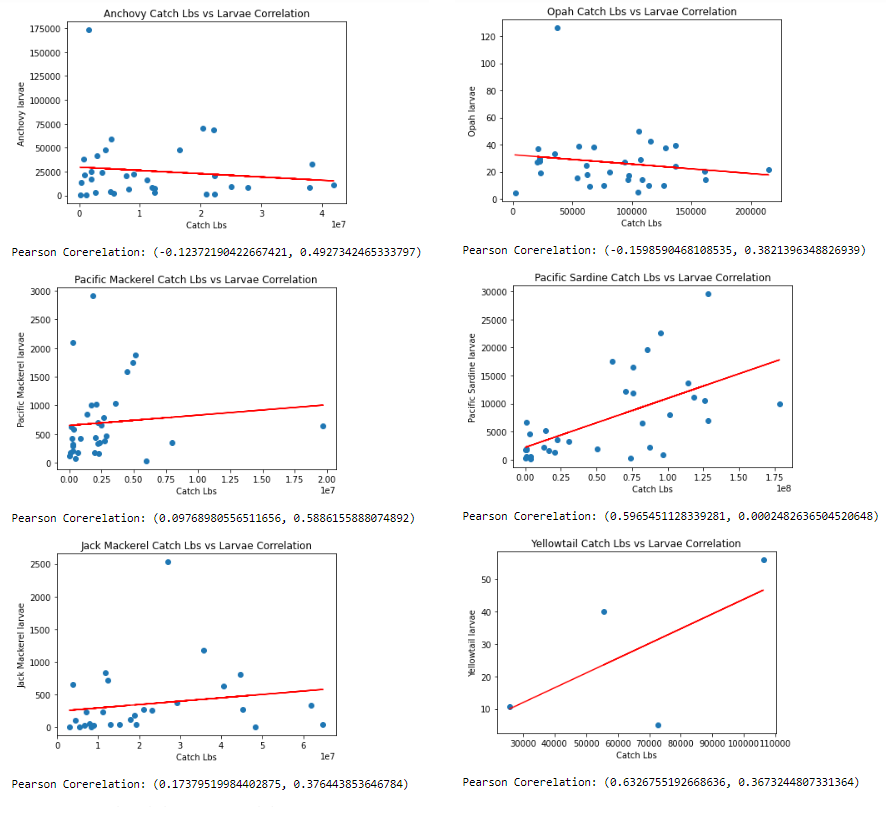
These graphs showcases the correlation between the total catch of an individual fish in a single year versus how much larvae was seen that year. Not all the fish display the same correlation or result, but when looking at sardine, we see that the correlation between those two attributes are significant. Thus, we can infer from this that more sardine was caught in a single year, likely explained by there being more adult sardine to be caught. If that premise is true, then because there are more adult fish, more adult fish would be laying more larvae, which explains why there is a positive correlatin between total catch and larvae count.
c) Total Catch vs. Larvae Amounts (lagged)
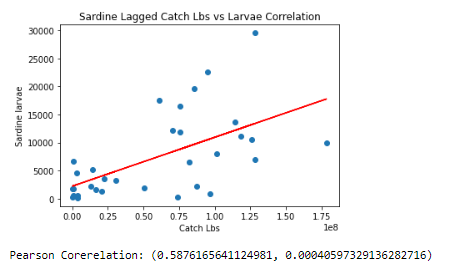
Using the insight granted from the second graph, we plotted a graph showcasing a lagged correlation between total catch and larvae amount. This is to see if there is a possibility on whether the amount of larvae that was seen would hatch out and become adults in the future to be caught. The graph showcases that there is a significant result for a positive correlation where the more sardine larvae there is, the more fish that is to be caught in the future years because more fish are becoming adults from those larvae.
d) Total Catch vs. Larvae Amounts (with years)
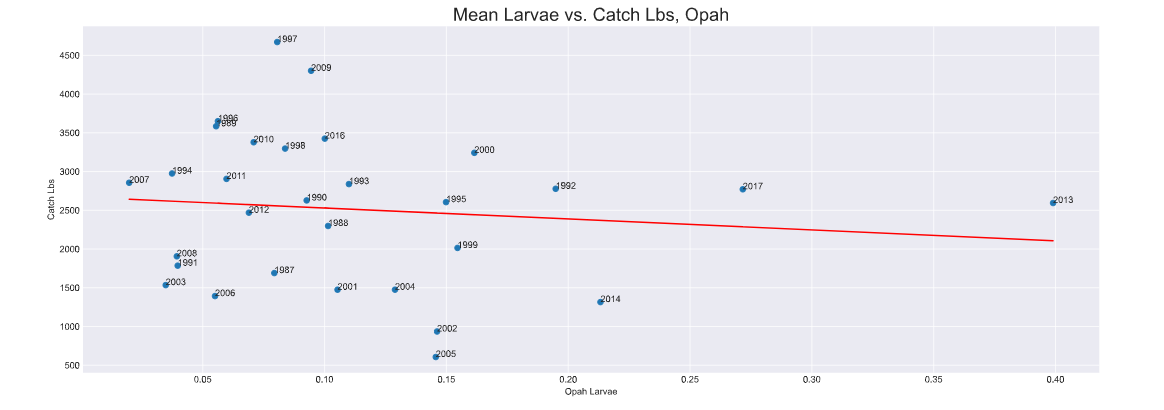
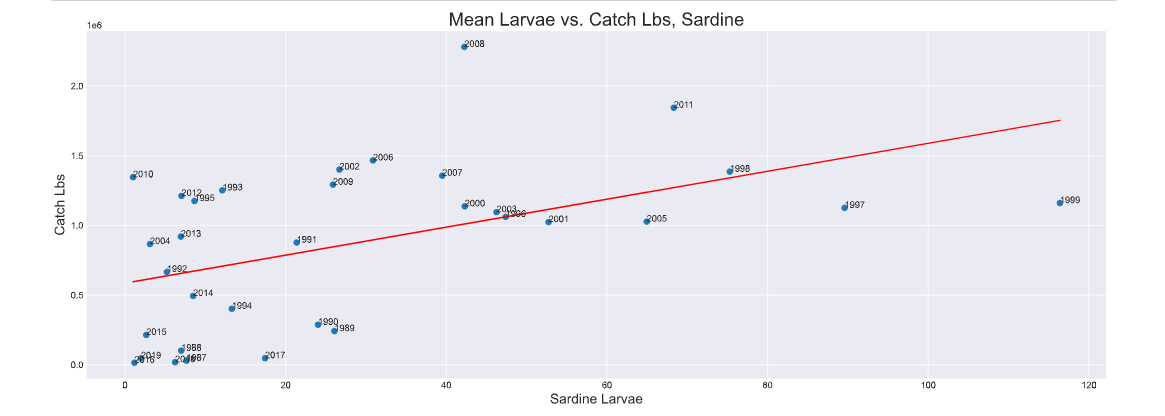
Additionally, we created plots that visualized the relationship between catch pounds and larvae amounts, with the associated year on each point. Our intention with these plots was to explore whether there was a relationship between a grouping of years that might influence the catch pounds. These graphs were reproduced for each of the 6 species.
Part 2: Exploring the Effect of Extreme Weather Events
We also explored the relationship between fish larvae and extreme weather events, such as El Nino and La Nina. Since these weather events affect the warming and cooling of ocean temperatures, we wanted to see if they played a role in the amount of larvae found.
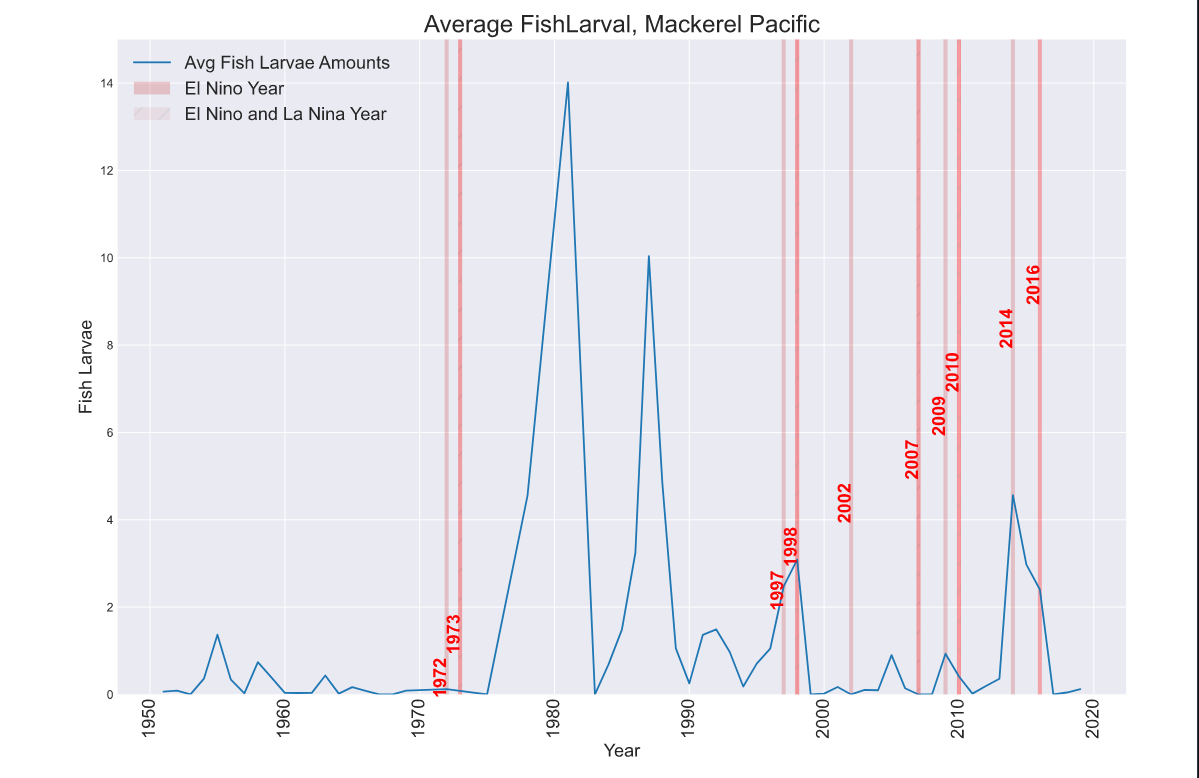
The plot above shows the average amount of mackerel jack fish larval found each year, along with lines that depict when an El Nino or La Nina event starts and ends. The goal was to identify trends during years with weather events.
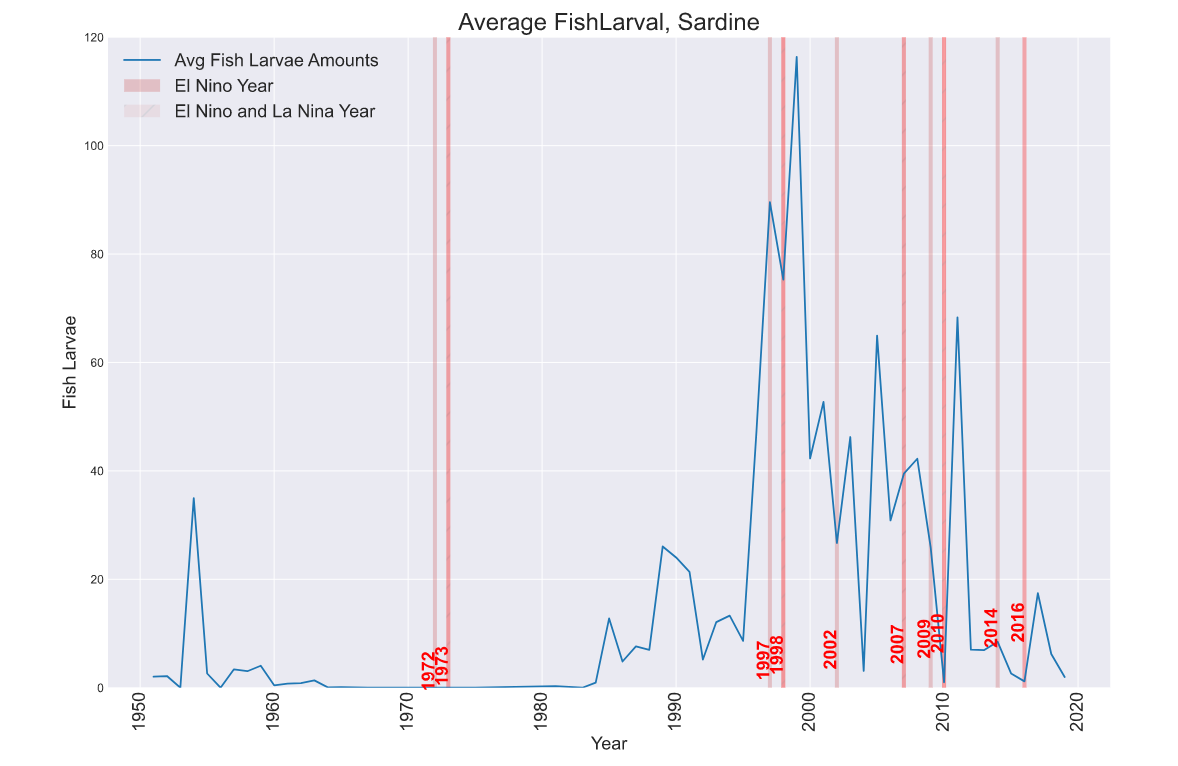
Similar to the previous visualization, we created these weather event plots for each of the 6 fish species. Although it was difficult to see immediate trends, we plan on spending more time investigating the effect that these weather events have on fish larvae amounts. Ideally, we would be able to isolate certain years and see if changes in fish larvae are signiciant or not.
Conclusion: Update 2
Since the first update, we have continued to focus on conducting exploratory analysis, with the intention of finding some meaningful correlations between larvae amounts and catch pounds. In the coming weeks, we plan on doing more exploratory analysis, and then deciding on a primary focus for the project.