Update 2
Overview
The dataset we are working with contains data on interactions between bees and plants. Each row represents an interaction, and the data comes from museum records, publications, and from people submitting their sightings/observations to be recorded online. There are columns detailing the taxonomy of the bees and the plants, like what family, genus, or species they belong to. There is also a column detailing what is the source of this sighting, which is the citation.
After doing some exploratory analysis from our first update, we had a clearer sense of the goals and direction of this project. Our major goal for the next few weeks is to identify which bees are the type to visit a lot of different flowers (generalists) and which bees are the type to visit the same few flowers (specialists). To accomplish that, we figured that making visualizations would help answer some of our questions.
However, classifying bees as generalists or specialists becomes tricky because of all the taxonomic levels we need to consider. For example, a bee genus may be considered as a generalist genus but there might be one bee species in that genus that is a specialist, which can be confusing. Additionally, there were many combinations of taxonomic levels that we can look at, such as family-to-family, family-to-genus, family-to-species, genus-to-family, genus-to-genus, genus-to-species, etc. This adds layers of complexity to our problem. Also, the definition of what makes a bee a specialist or generalist depends on what taxon level we are looking at. For example, a bee genus can be considered as a generalist since it visits many different plant genera. But what happens when we look closer and see that most of those plant genera belongs to the same family? Is the bee genus considered a specialist or generalist now? We will need to keep these ideas and challenges in mind as we continue with our project.
To reiterate, our major goal is to identify which bee families/genera/species are generalists or specialists. Another goal is to identify biases in the data.
Progress
Week 5
This week we focused on cleaning the data into something we can collaboratively work with together. Instead of all of us having our own code for cleaning the data, we want to have a script that is used to clean data periodically so that we can work on the same exported data. The original file contains all recorded biotic interactions, and we want to create a file with only bees <-> plants interactions.
In order to spot all entries with bees, we filter the animal family with the seven bee families: Andrenidae, Apidae, Colletidae, Halictidae, Megachilidae, Melittidae, and Stenotritidae. The criterion for plants is simply TaxonKingdomName == “Plantae”. The interactions would be either bees as source and plants as target, or plants as source and bees as target, which we predict would have less entries. Other specific requirements include case insensitivity and removing duplicate entries.
Week 6
We compared the cleaning script from the Python team to that of the R team. We found that the observation count of the R and Python groups were close but not exact. The issue of duplicate rows was discussed in greater detail- trying to figure out whether duplicate observations were erroneous or true citations. We decided to use the reticulate package in R to call Python code from RMarkdown so that we would have one consistent cleaning script. In addition, we reviewed our visualizations- network graphs and heat maps, focusing on specifics such as color-coding nodes by taxon family. We also spent some time discussing our long-term objective relating to classifying certain bees as specialists or generalists. A generalist can thrive in various environmental and temporal conditions while a specialist can only survive in more specific conditions. For example, a bee species that interacts with 40 different plant families may be more generalized than a bee species that interacts with 10 plant families.
Week 7
For this week, we discussed how to decide what interactions are meaningful or not. For example, there are instances where a bee visits a particular plant only once, and this seems insignificant when there are other interactions that have been recorded between the same bee and plant thousands of times. We also found some observations in our dataset that have been entered incorrectly by people, so the maintainers of the dataset have been notified of this error.
More importantly, we decided to focus on studying the different levels of specialization for the bees. We were tasked with finding out the connections at these levels:
-bee families to plant families, genera, and species
-bee genera to plant families, genera, and species
-bee species to plant families, genera, and species
We needed to explore these varying levels of specialization with the Apidae, Halictidae, and Andrenidae bee families.
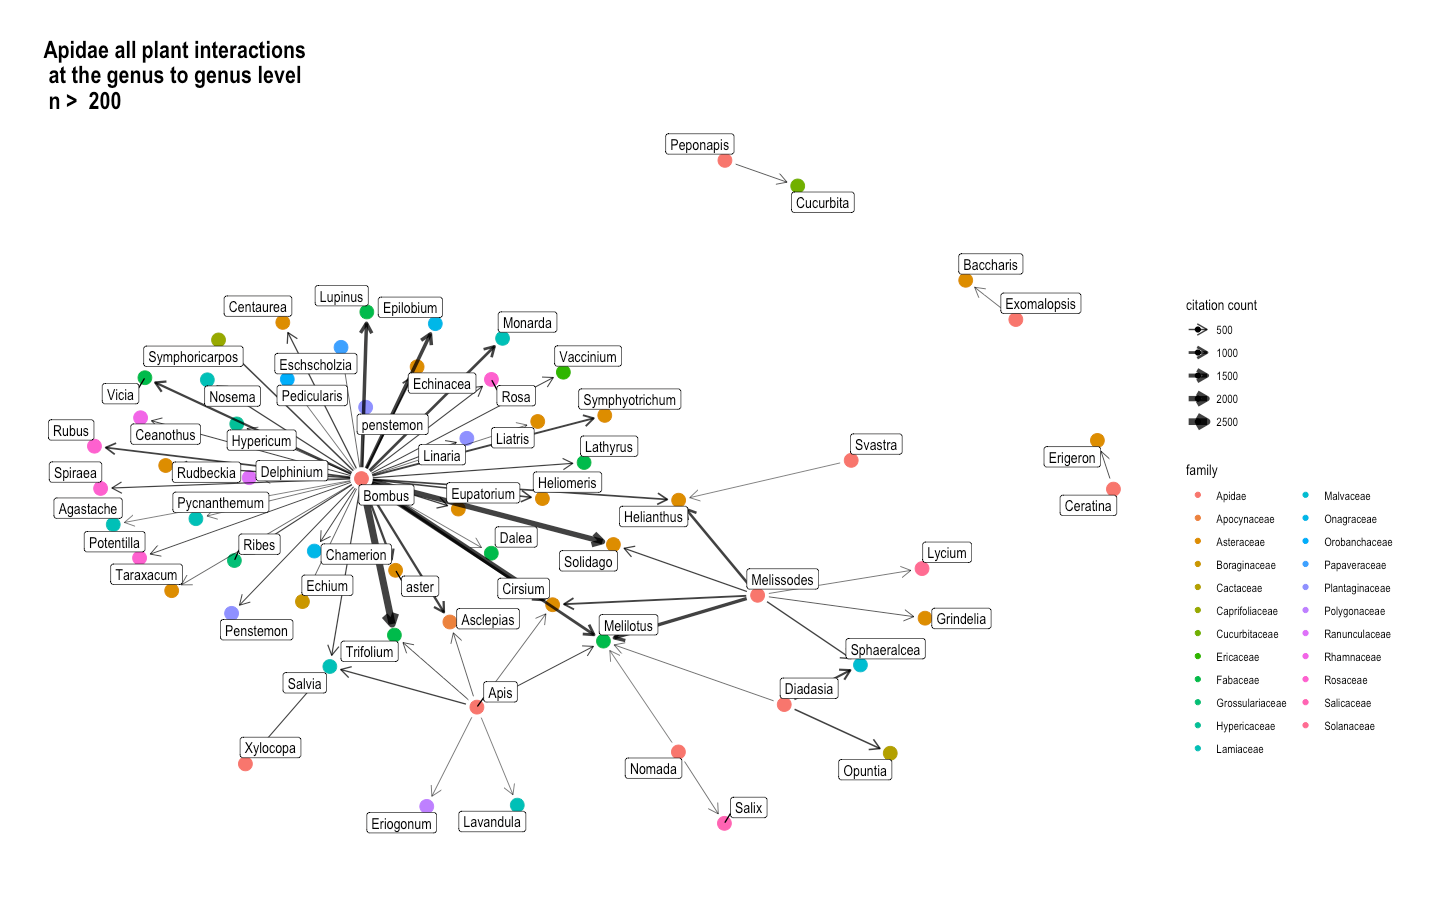
Fig. 16 The interactions between the genera from the Apidae bee family and all plant genera, presented as a network graph. Here, citation count is synonymous with interaction count. The more interactions a bee genus has with a plant genus, the darker the lines. Since there were lots of interactions that only happened once, we decided to make a cut-off point at 200 interactions in order to filter for the most important interactions. The nodes are color-coded by family.
In Figure 4, the interaction that occurred the most times is between the Bombus genus and Trifolium genus. The genera in the Apidae family mostly seem to be generalists, especially Bombus.
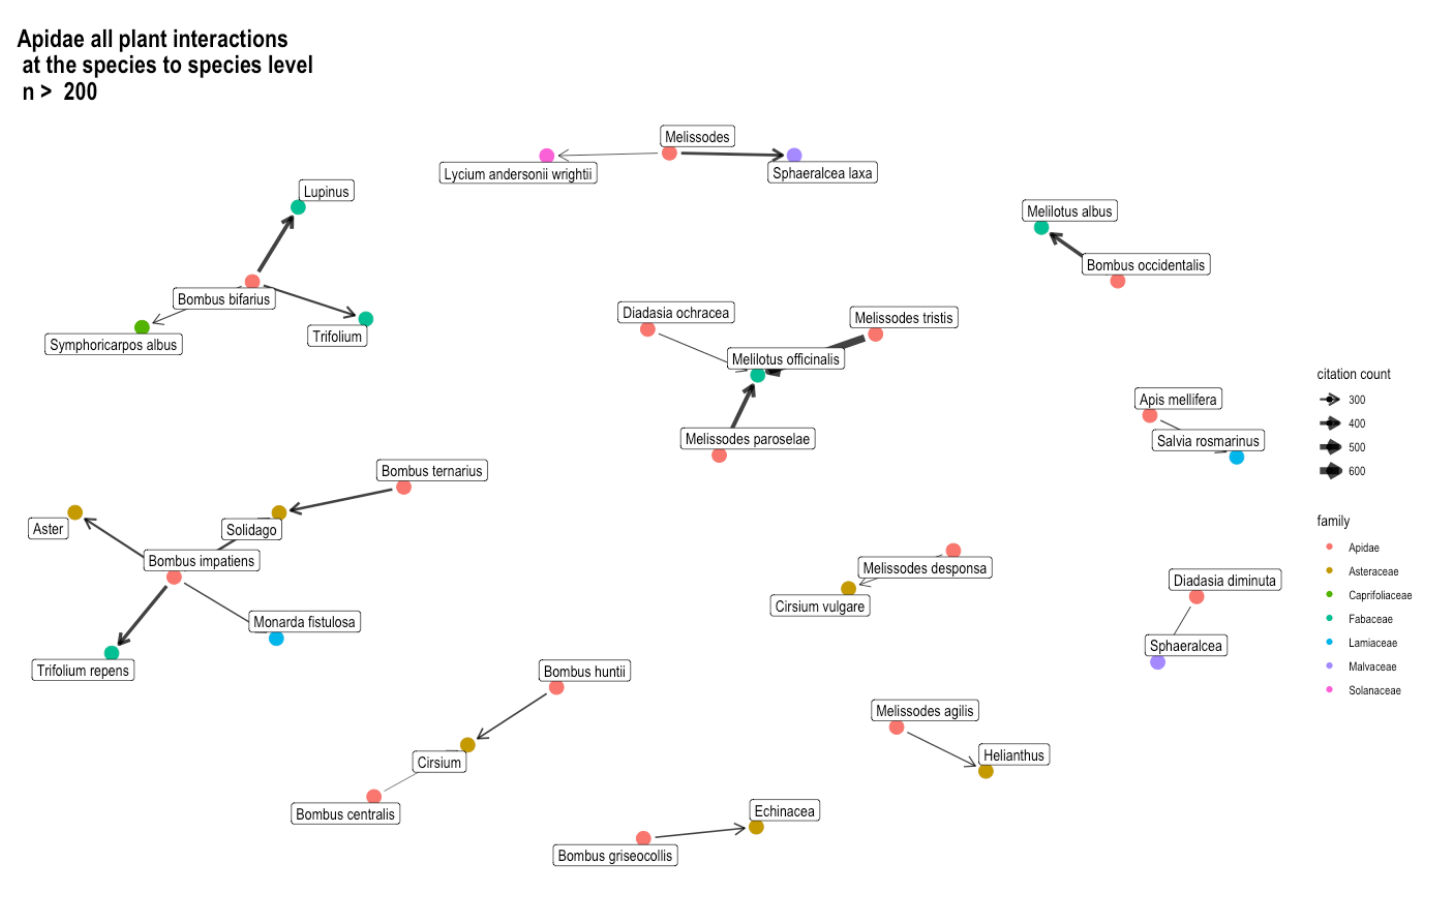
Fig. 17 The interactions between the species from the Apidae bee family and all plant species or genera, presented as a network graph. Again, the citation count is synonymous with interaction count. The cut-off point remains at 200 interactions in order to keep the network graph more simple and easier to understand. The nodes are color-coded by family.
In Figure 5, the interaction that occurred the most times is between Melissodes tristis and Melilotus officinalis. Here, Bombus bifarius and Bombus impatiens appear to be generalists. Meanwhile, the bee species Diadasia ochracea, Melissodes tristis, and Melissodes paroselae all seem to prefer to visit only Melilotus officinalis (yellow sweet clover), which may indicate that they are specialists.
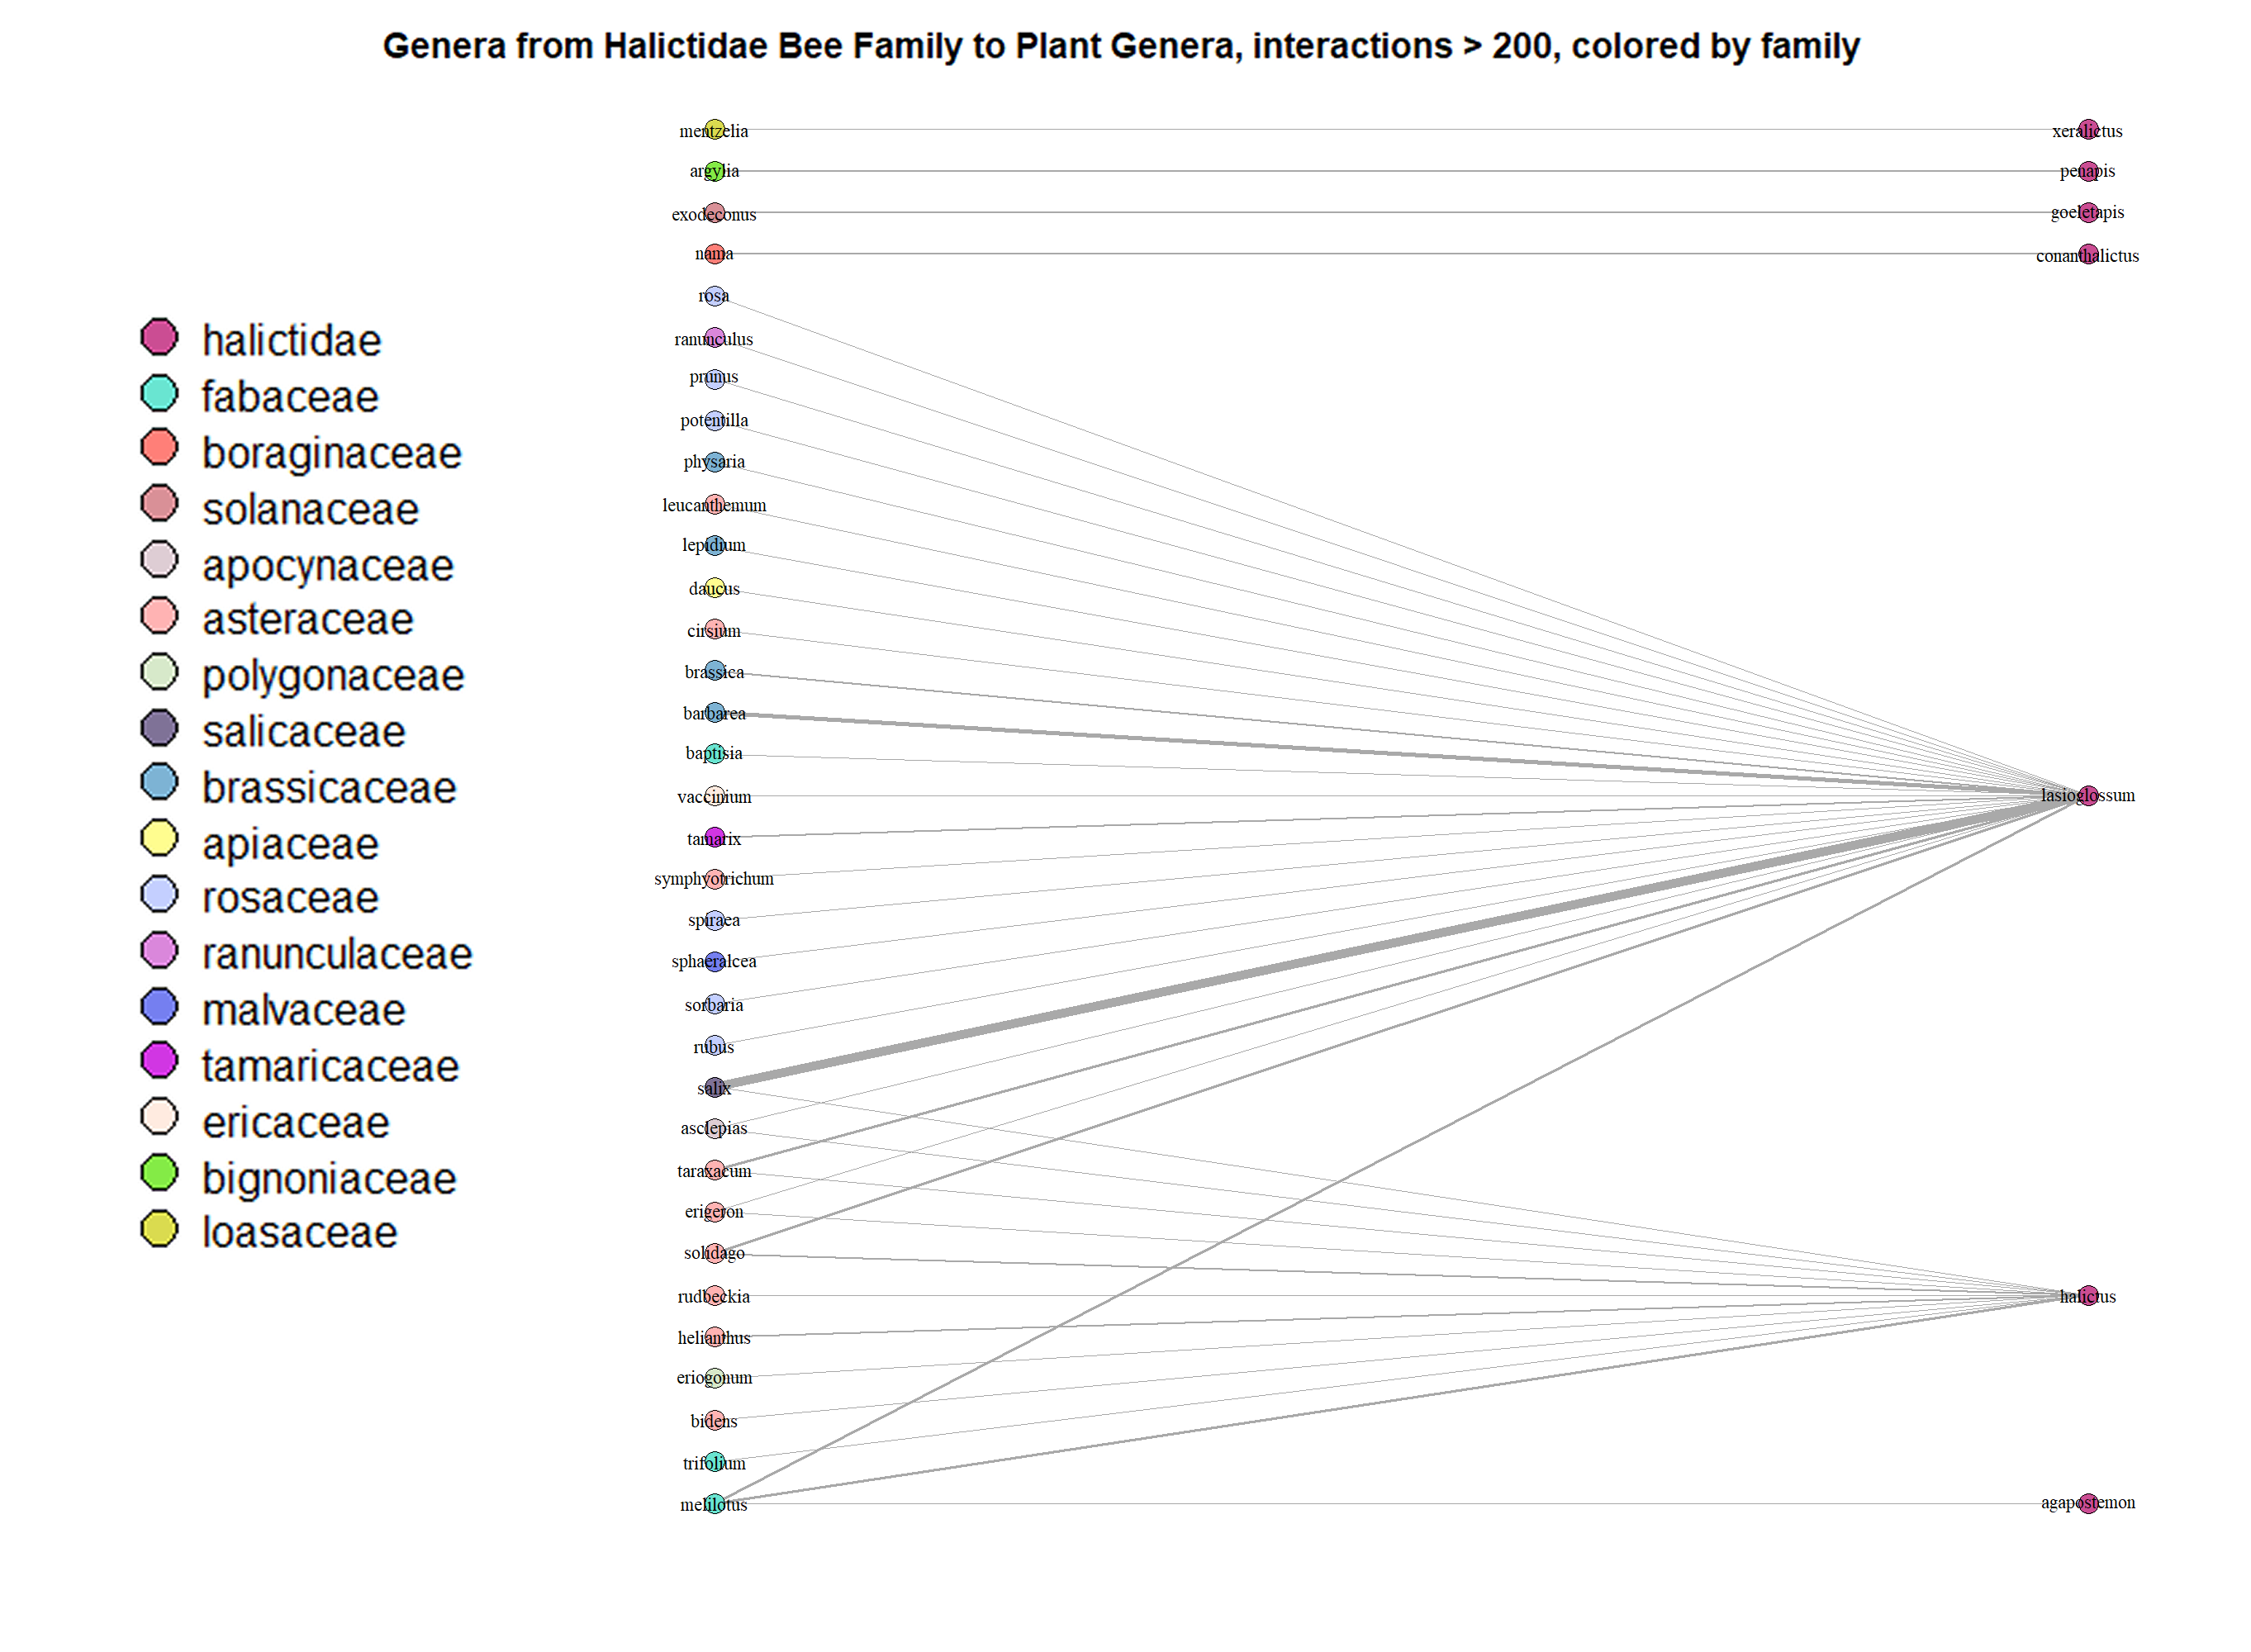
Fig. 18 The interactions between the genera from the Halictidae bee family and all plant genera, presented as a network graph. The cut-off point remains at 200 interactions in order to keep the network graph more simple and easier to understand. The nodes are color-coded by family.
We can tell from Figure 6 that the Lasioglossum and Halictus bee genera visits many different plant genera/families. On the other hand, Agapostemon, Conanthalictus, Goeletapis, Penapis, and Xeralictus prefer to visit one plant genus each, making them appear to be specialists.
Week 8
After last week’s discussion of targeting different levels of specialization for bees, we were able to further explore these different levels. Specifically, we found heatmaps to be a great way of finding interactions at different levels that are significant. While the heatmaps enabled us to identify particularly interesting plant bee relationships, and also gave us a quick and general way to identify specialists/generalists, we found that comparing these relationships was hard to quantify using heatmaps. By using bar plots to better study and quantify the differences between relationships we had found, we were able to look into various levels of species interaction in a much more informatve context.
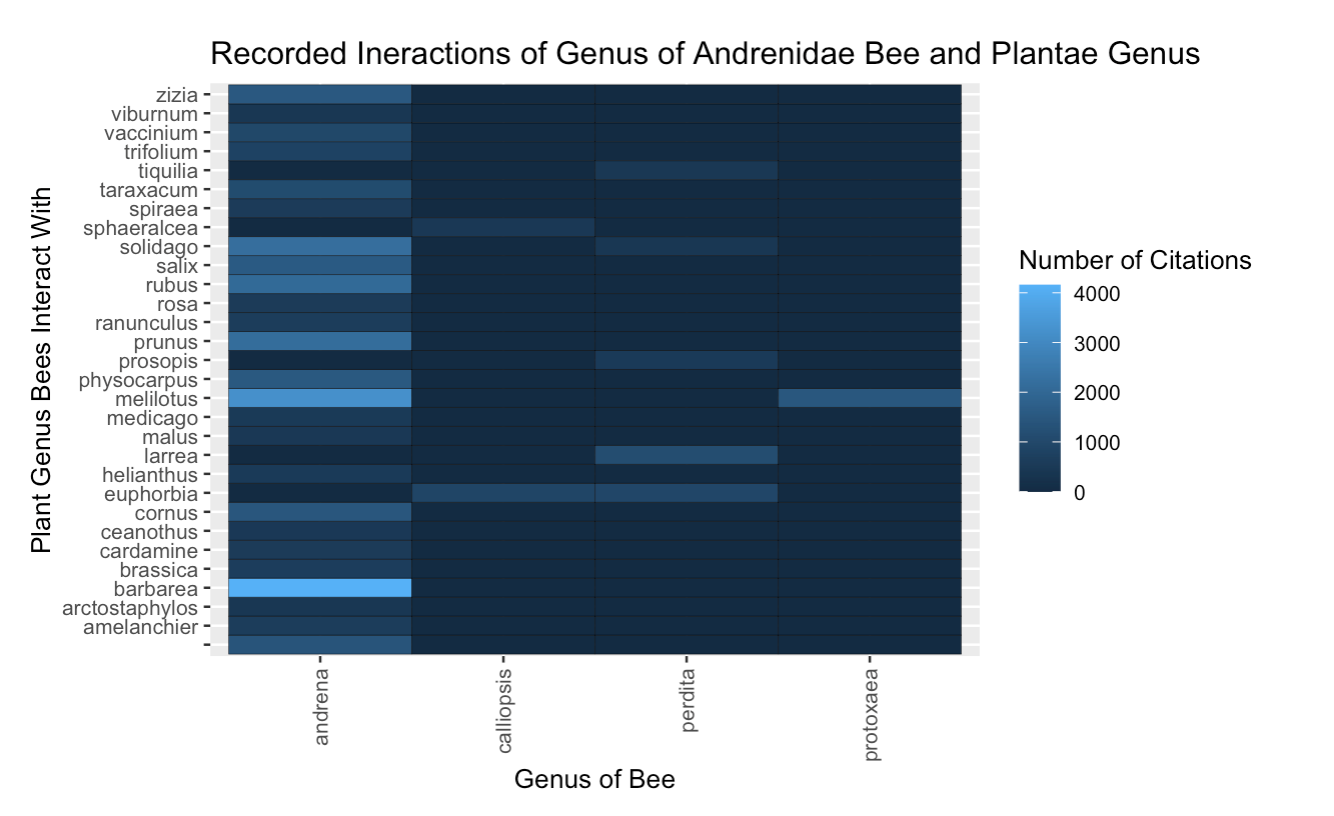
Fig. 19 The interactions between the genera from the Andrenidae bee family and all plant genera, presented as a heatmap. The citation count is synonymous with interaction count. The lighter areas mean that that particular bee genus has interacted with that plant genus many times.
Most of the interactions in the Andrenidae bee family came from the Andrena genus. We can see from Figure 7 that bees in the Andrena genus vists many other plant genera, which indicates that they may be generalists.
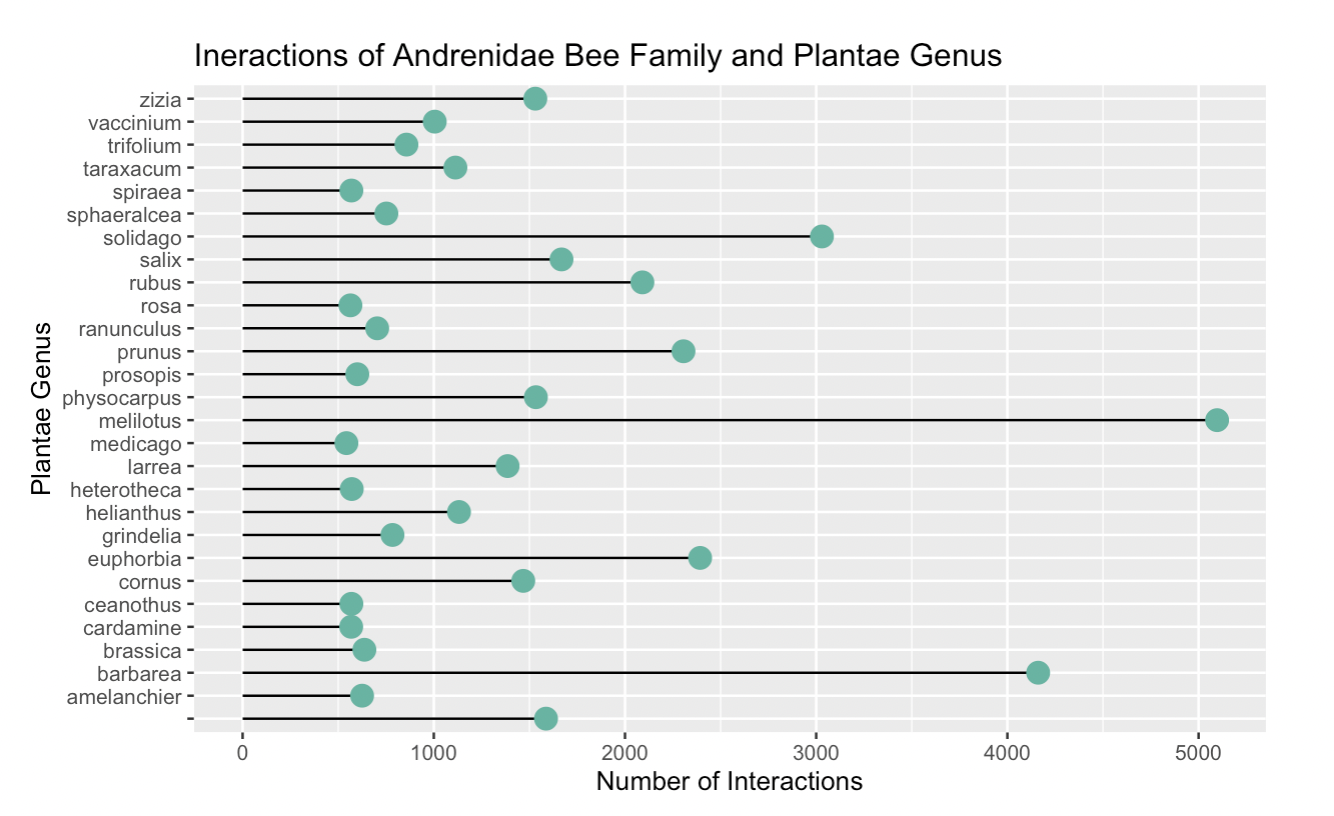
Fig. 20 The interactions between the Andrenidae bee family and all plant genera, presented as a bar plot. The citation count is synonymous with interaction count.
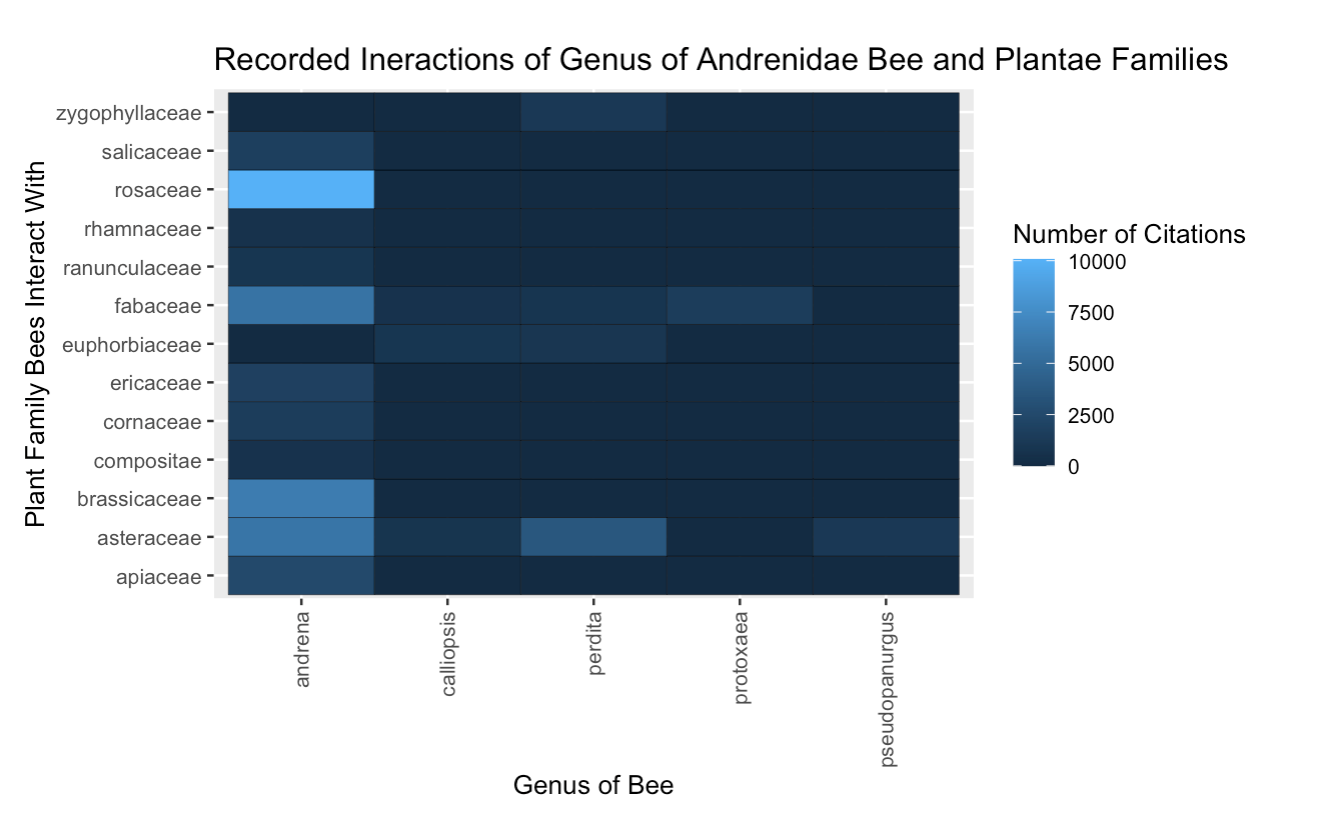
Fig. 21 The interactions between the genera from the Andrenidae bee family and all plant families, presented as a bar plot. The citation count is synonymous with interaction count.
We can see again from Figure 9 that the Andrena bees visit many other plant families, which supports the idea that they may be generalists.
Conclusion and Next Steps
We cannot determine for certain which types of bees are specialists or generalists yet because these visualizations may not tell the whole story, but it’s a good start. We will need to investigate statistical methods and models to support our hypotheses from the visualizations because we cannot just draw conclusions based on the visualizations alone.
Additionally, there are some sources of bias in our data that we became aware of. For example, some bees may be limited to only certain regions of the world, and they may only come out during certain times of the year. Or, they may be overrepresented or underrepresented in our dataset due to imperfect detection. Bee interactions with plants that happen in less observable places or time may be cited less despite equal occurrence. Another source of bias we learned from our sponsors is that maybe some people neglect to report the sighting of a common bee just because it appears many times and is not considered rare/special. All of these biases play an important role in our process of deciding the pollination preference of the bees so we need to take these into account for our next steps.
In the future, we will explore a bee genus’ degree of generalization vs. the frequency at which it appears in the dataset. The degree of generalization is defined as the number of different plant families that the bee genus visits and the frequency is how many times that genus appears in the dataset. We are looking to perform more correlation tests to better understand this relationship between the two variables. Specifically, we are working on getting the Spearman’s rank correlation coefficient. We also hope to implement various machine learning methods (like support vector machine) to classify each bee as a generalist or a specialist- doing so by gaining access to or creating our own training set.