Update 1
Center for Science and Engineering Partnerships (CSEP) Project

Capstone Members
Manny Medrano, Andrea Anez, Romtin Toranji, Karanveer Benipal
Faculty:
Alexander Franks, Lubi Lenaburg, Joshua Bang
Introduction
The CSEP Alumni Tracking Project tracks students graduating from 2000 - 2018 from the University of California, Santa Barbara. The overall goal of tracking students is monitoring opportunites UCSB provides and the impact on student outcomes.
The data comes from a mix of sources: online - LinkedIn, personal websites, and professional organizations - and UCSB’s own information about students. While not all of the data was accessed through an automated system, some of it required some manual revisions to determine if a student’s data is updated. So while we collected from some of the sources listed above, there will exist some type of error whether it is a simple mispelling of a word to texts existing in an integer column.
The organization providing the data does not have an overall goal for the outcome of the data: the CSEP group is free to explore any possible avenue for the data within reason.
Accessing the Secure Research Compute Environment (SCRE)
SCRE is a way for the team to access the data without having any breaches in the security of the data itself. Because the data we are using is of actual past UCSB alumni, we don’t want to expose any sensitive information of each individual. While on SCRE, we’re not only able to access this information, but we’re also able to play around with it in python code on our virtual machines!
More specifically, each capstone member is assigned a specific Virtual Machine (VM) that allows the designated user to access the data through that VM. An important aspect to note is that while UCSB maintains a complete and thorough alumni dataset, not all of it is allocated to our team. The Family Educational Rights and Privacy Act (FERPA) restricts the alumni and student information that institutions such as UCSB can release. For this reason, our team only works with a portion of the alumni dataset in a secure environment as a means to respect the privacy of UCSB alumni and students.
Goals
Here are some possible avenues we can explore:
Outcomes by Major
Ranking of Graduate Schools UCSB students attend
Graduate Engineering Students
Job Opportunites
Geographical Distribution of Students
By Major
By Admit Status
By career choice
Freshmen vs. Transfer Admit Outcomes
Greek life vs Non-Greek life Students
Career outcomes for athletes
Female athletes in leadership roles
Students from low-income high schools
Distribution by undergradute major
Career outcomes and future earnings
While these are our goals, we have made some progress working towards some of these, yet this is only the beginning.
Graduate Engineering Students
Since a big part of the project has been tracking the progress of stem majors, we thought it was a good idea to take a look at how many engineering students has earned some sort of graduate degree. This does not consider graduate students that are currently attending nor those that received a professional/teaching/MS degree.
The goal of this was to see if the number of engineering students obtaining a graduate degree has decreased over the years. A big reason for this has been engineers seem to pursue jobs in industry since its a readily available opportunity after obtaining a BS degree.
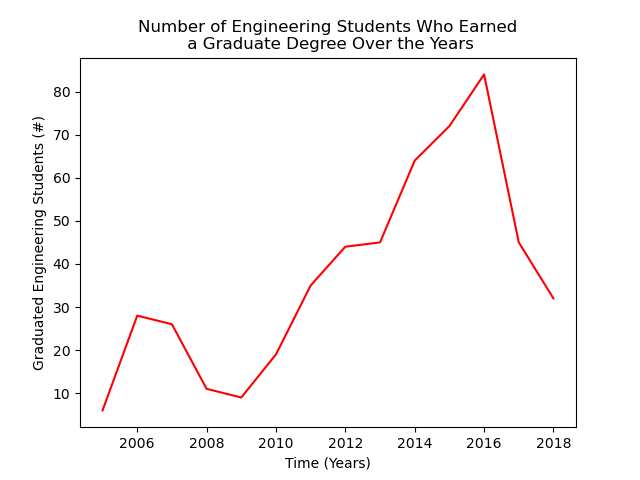
Fig. 25 In the plot, we can see the increasing number of students who obtain their Graduate degree.
Some things to note is that the range of data is from 2000 to 2018 so many students are initially going to graduate school and there is a huge rise because of this. Another thing is that not all students immediately enter in a graduate program (i.e. some students take a gap year or work in industry first).
We can see there exists a drop off in the beginning of the plot because there hasn’t been enough time for students to enter graduate school right away.
Undergraduate Students from Low-Income High Schools
High schools throughout California are far from equal in terms of how they prepare students for college. Additionally, most high schools serving underprivileged students lack strong STEM programs and few offer computer science classes. A study by the Kapor Center found that high schools where most students are black, Latino and Native America, only 39 percent offer computer science courses, compared with 72 percent of schools where white or Asian students make up the majority. Additionally, Computer science courses are more often offered at high-income schools (55 percent) than at low-income schools (35 percent.) Do students who attended high-income highs schools have an advantage when it comes to being admitted to UCSB’s College of Engineering? Are students from low-income high schools being served equally by UCSB’s STEM programs?
Socioeconomic Background of Freshmen Admits at UCSB by Major
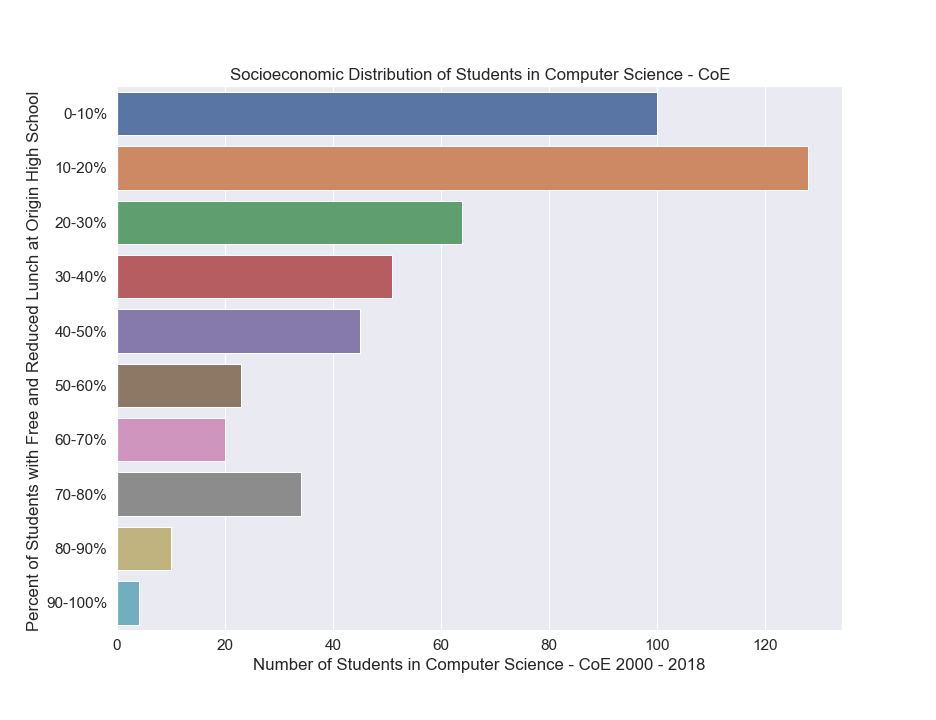
Fig. 26 Socioeconomic Distribution of Students in Computer Science
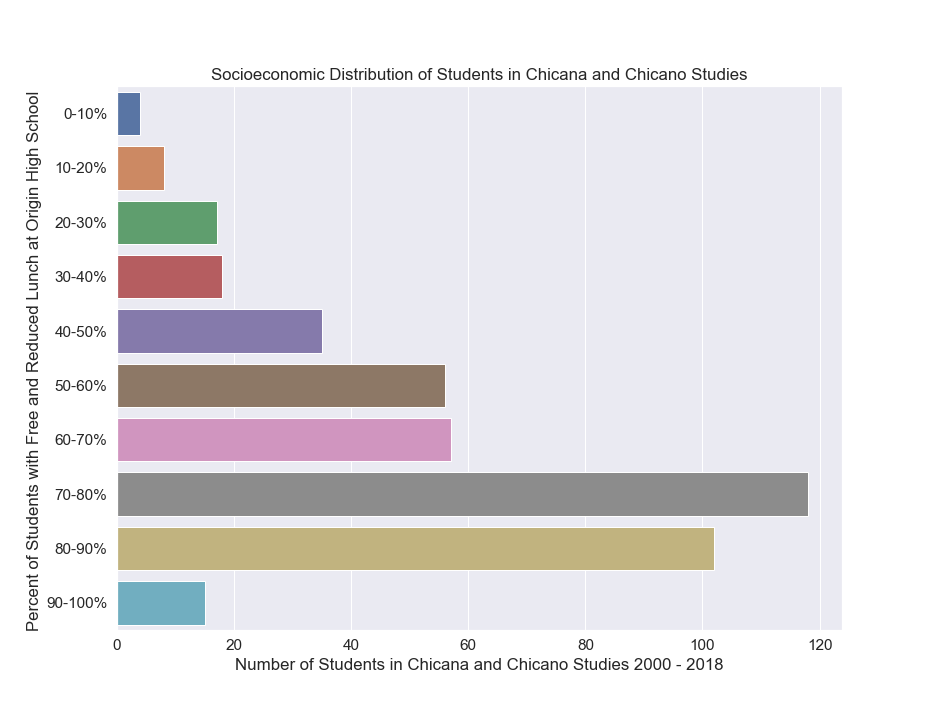
Fig. 27 Socioeconomic Distribution of Students in Chicano Studies
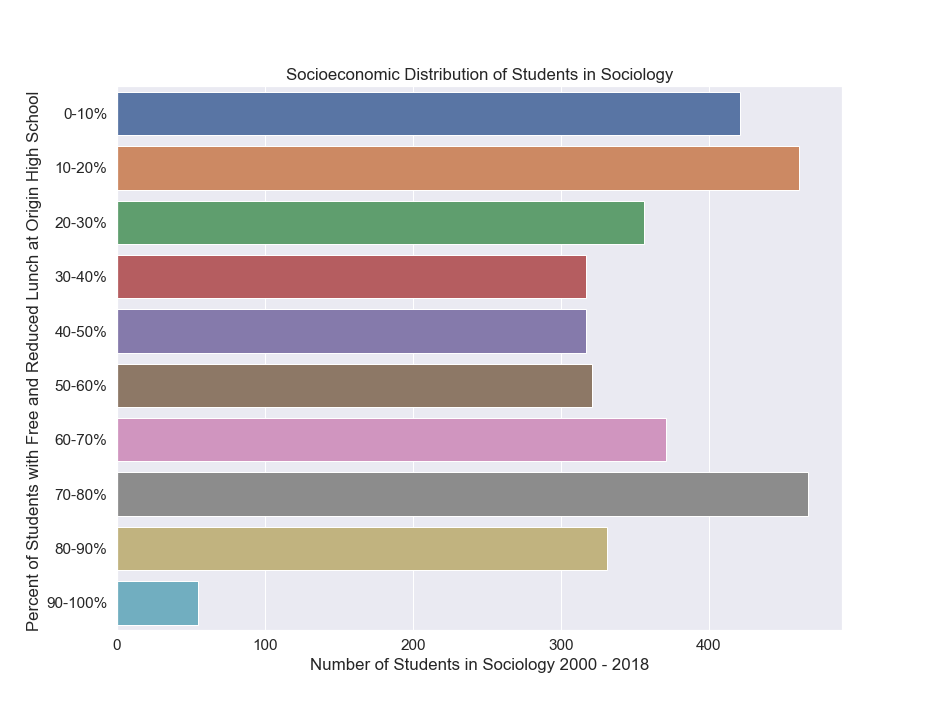
Fig. 28 Socioeconomic Distribution of Students in Sociology
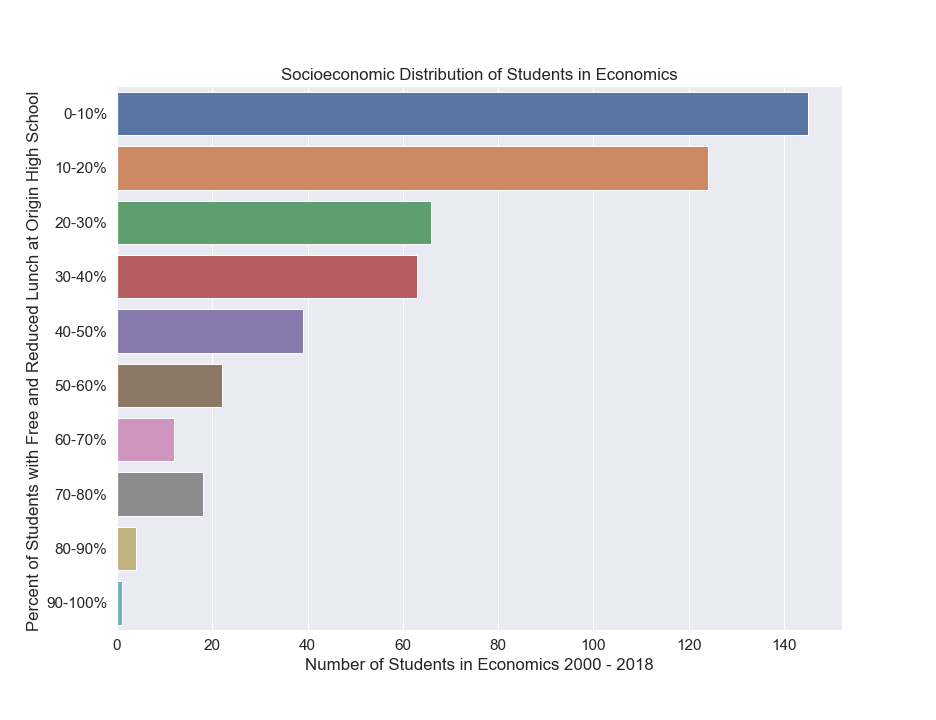
Fig. 29 Socioeconomic Distribution of Students in Economics
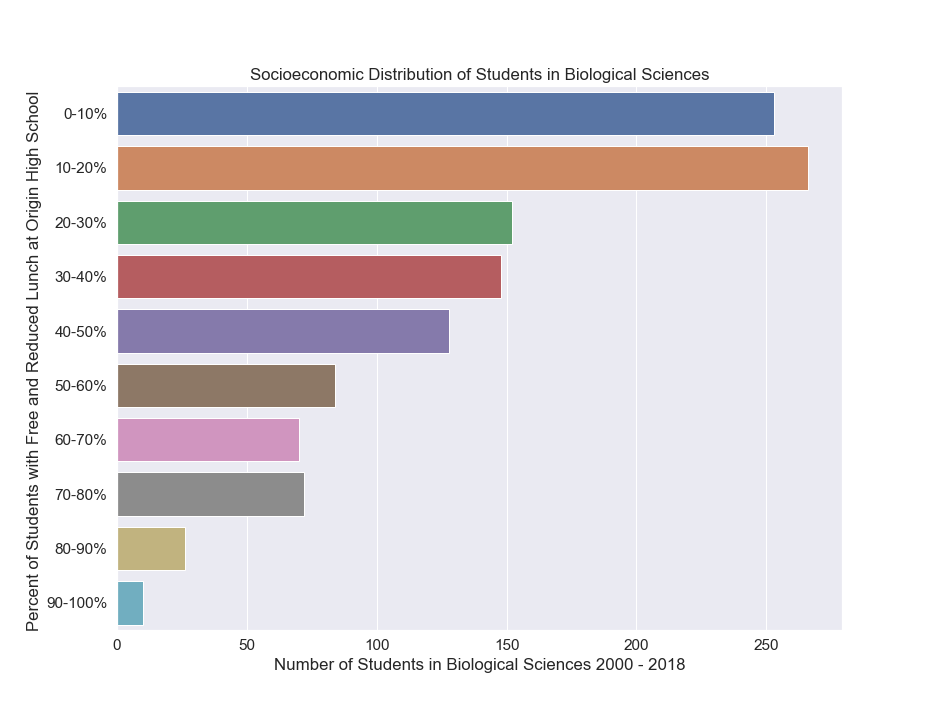
Fig. 30 Socioeconomic Distribution of Students in Biology
When looking at these perliminary graphs we can see that majors in STEM feilds are disproportionately populated by studnets from affluent high schools. Currently, these graphs do not include students from out of state, international students or transfer students.
Freshmen vs. Transfer Admit Outcomes
Many people believe that transferring to a 4 year college because of the amount of money saved. Others believe attending a 4 year university for the full 4 years is the way to go. Taking a quick glance at the data we can see some differences. First we see transfer students obtaining Minors and Bachelors of Science at a higher rate than Freshmen admits. Meanwhile, Freshmen Admits have a higher rate of receiving Bachelors of Art, Bachelors of Fine Arts, and Bachelors of Music.
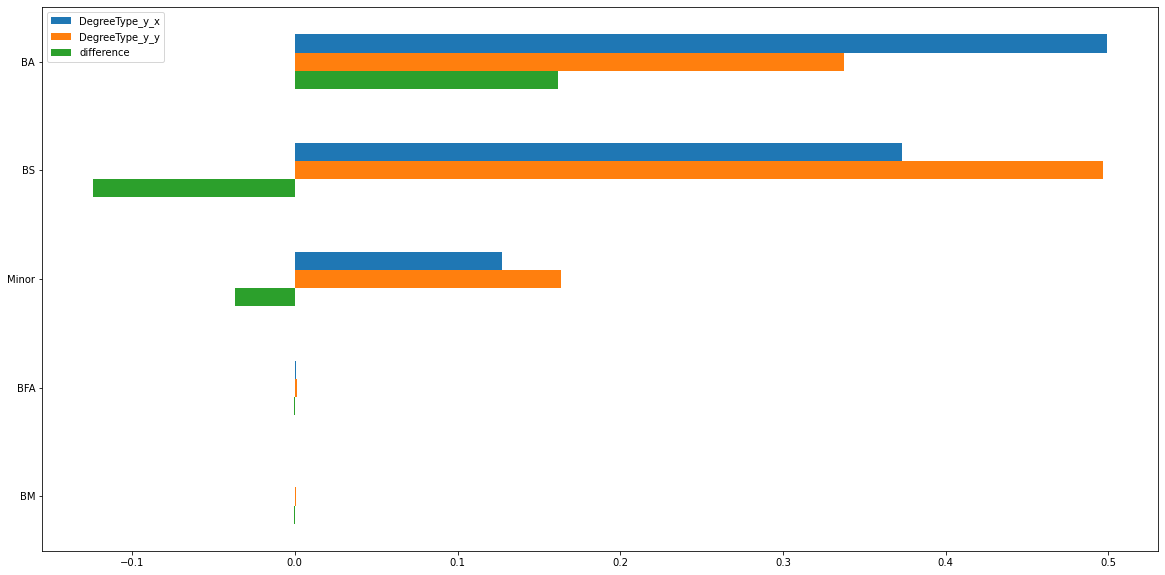
Fig. 31 Degree Type Rate: Freshman vs Transfer
Also, there appears to be differences in degree types. The biggest being Transfers tend to have a higher rate of biology majors.
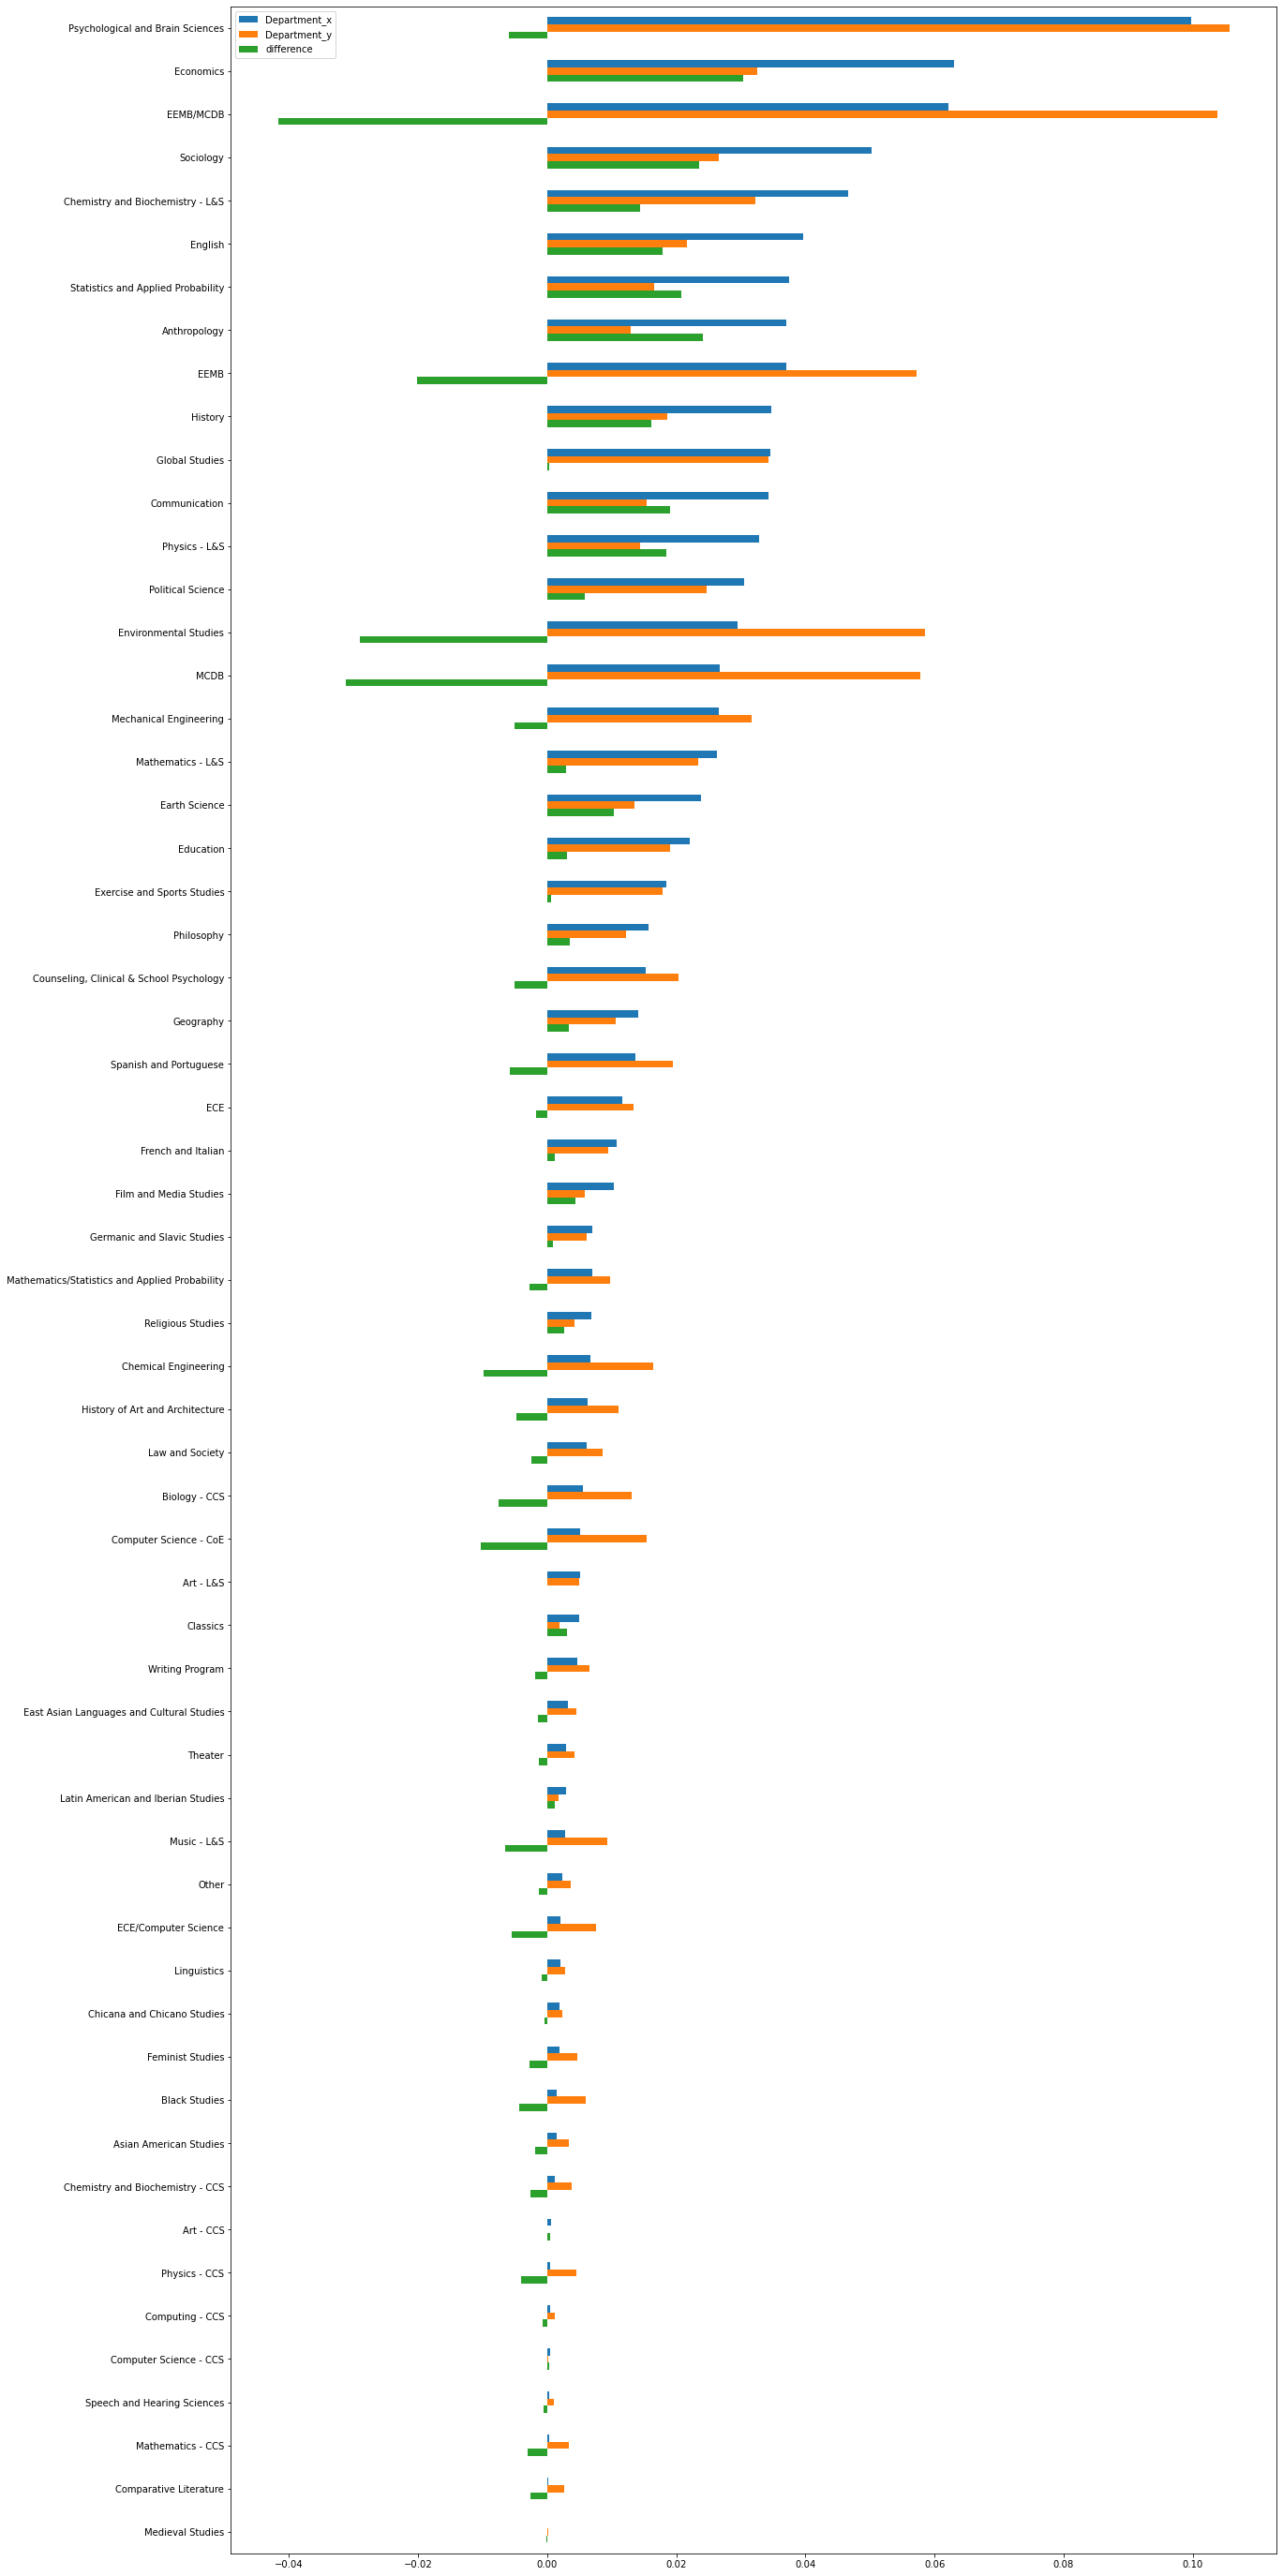
Fig. 32 Major Rate: Freshman vs Transfer
Finally, Freshmen admits also seem to work more in similar institutions with their peers.
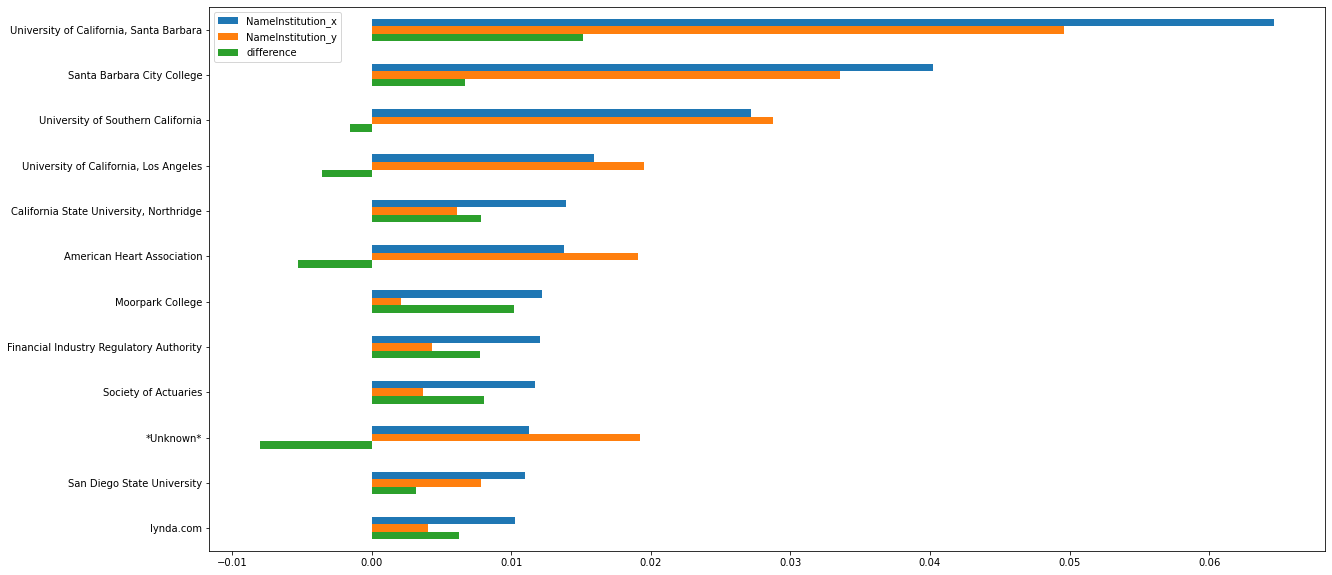
Fig. 33 Institutions: Freshman vs Transfer
Software Used
Python
SCRE
Excel