Update 2
Progress
Since our last update we’ve made considerable progress on our project. Early on we ran into some issues getting hardware setup for the group to work on. Considering it’s computationally expensive to train neural networks we weren’t able to train a model on our local machines so we spent a fair amount of time exploring our options to get a machine running that we could work with. We decided on setting up a virtual machine on google cloud so we could all remotely access the compute enginge. After getting that setup we got all our packages and notebooks running and started training.
Metrics used for understanding
To provide some insight into the metrics that we use to determine accuracy of the models we have a brief introduction to some of the commonly used ones that will be shown in this update.
Precision - True Positive/(True Positive + False Positive)
Recall - True Positive/(True Positive + False Negative)
Precision x Recall Curve(PR curve) - A plot of Precision vs. Recall
Average Precision(AP) - Area under the PR curve for each class
Mean Average Precision(mAP) - Average AP over all classes
IoU - Intersection of predicted and ground truth mask/Union of the predicted and ground truth mask. Visual below for reference.
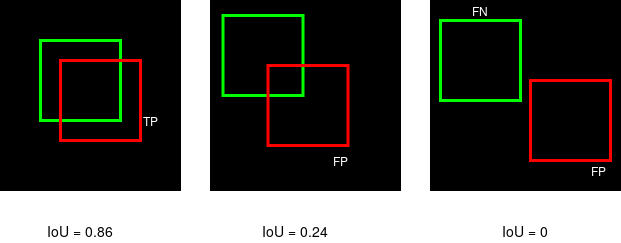
Fig. 39 IoU Visual
We use IoU to set a threshold that is used to categorize a predicted label as a true or false positive. The standard IoU threshold is generally 0.5 so our metrics will show our mAP evaluted at a threshold of .5 (mAP@0.5) and also a much higher threshold of mAP@0.5:0.95, this threshold is set at 0.5 and increases at a step size of 0.05 up to 0.95.
Training
First we trained a Yolo-V3 model with the attempt to reproduce the results from this medium article. The author used the same FLIR dataset that we have and was able to achieve production grade results with a mAP@.5 of .961 and a recall of .922.
Unfortunately we didn’t have as much success with our modified training procedure. Pictured below is our results with a Yolo-V3 model.
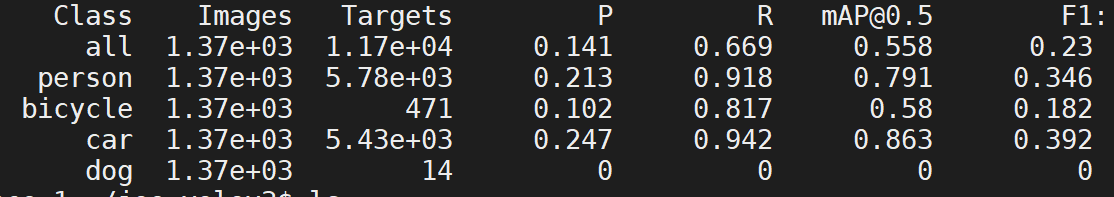
Fig. 40 Yolo-V3 metrics
Here our model differs from the author’s because we attempted to classify dogs and our dataset only contained 14 images with this label so we assume we didn’t have a large enough sample to accurately predict them. If we remove the dog classifications from our score our mAP@0.5 for all the classes would reach 0.745. Attempting to reproduce the results from the article was a lofty goal and considering the aim of our project is to analyze the effect of noise on a object detection model our main concern was to train a baseline model to test against later as opposed to acheiving the highest scores possible. Therefore we also decided to train the newest Yolo model, Yolo-V5, which we will use as our baseline for the time being.
Below is the scores from our Yolo-V5 model. We achieved higher scores across the board compared to V3 model and feel comftorable enough with these metrics to use as our baseline for testing. Note that we removed the dog classifications from this model.
Model we used for reference(https://github.com/ultralytics/yolov5)
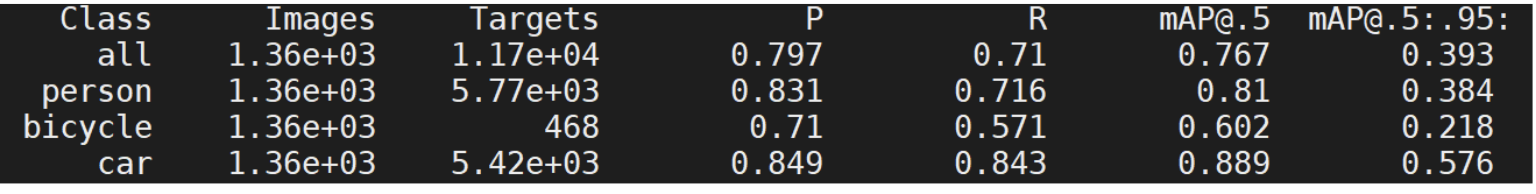
Fig. 41 Yolo-V5 Scores
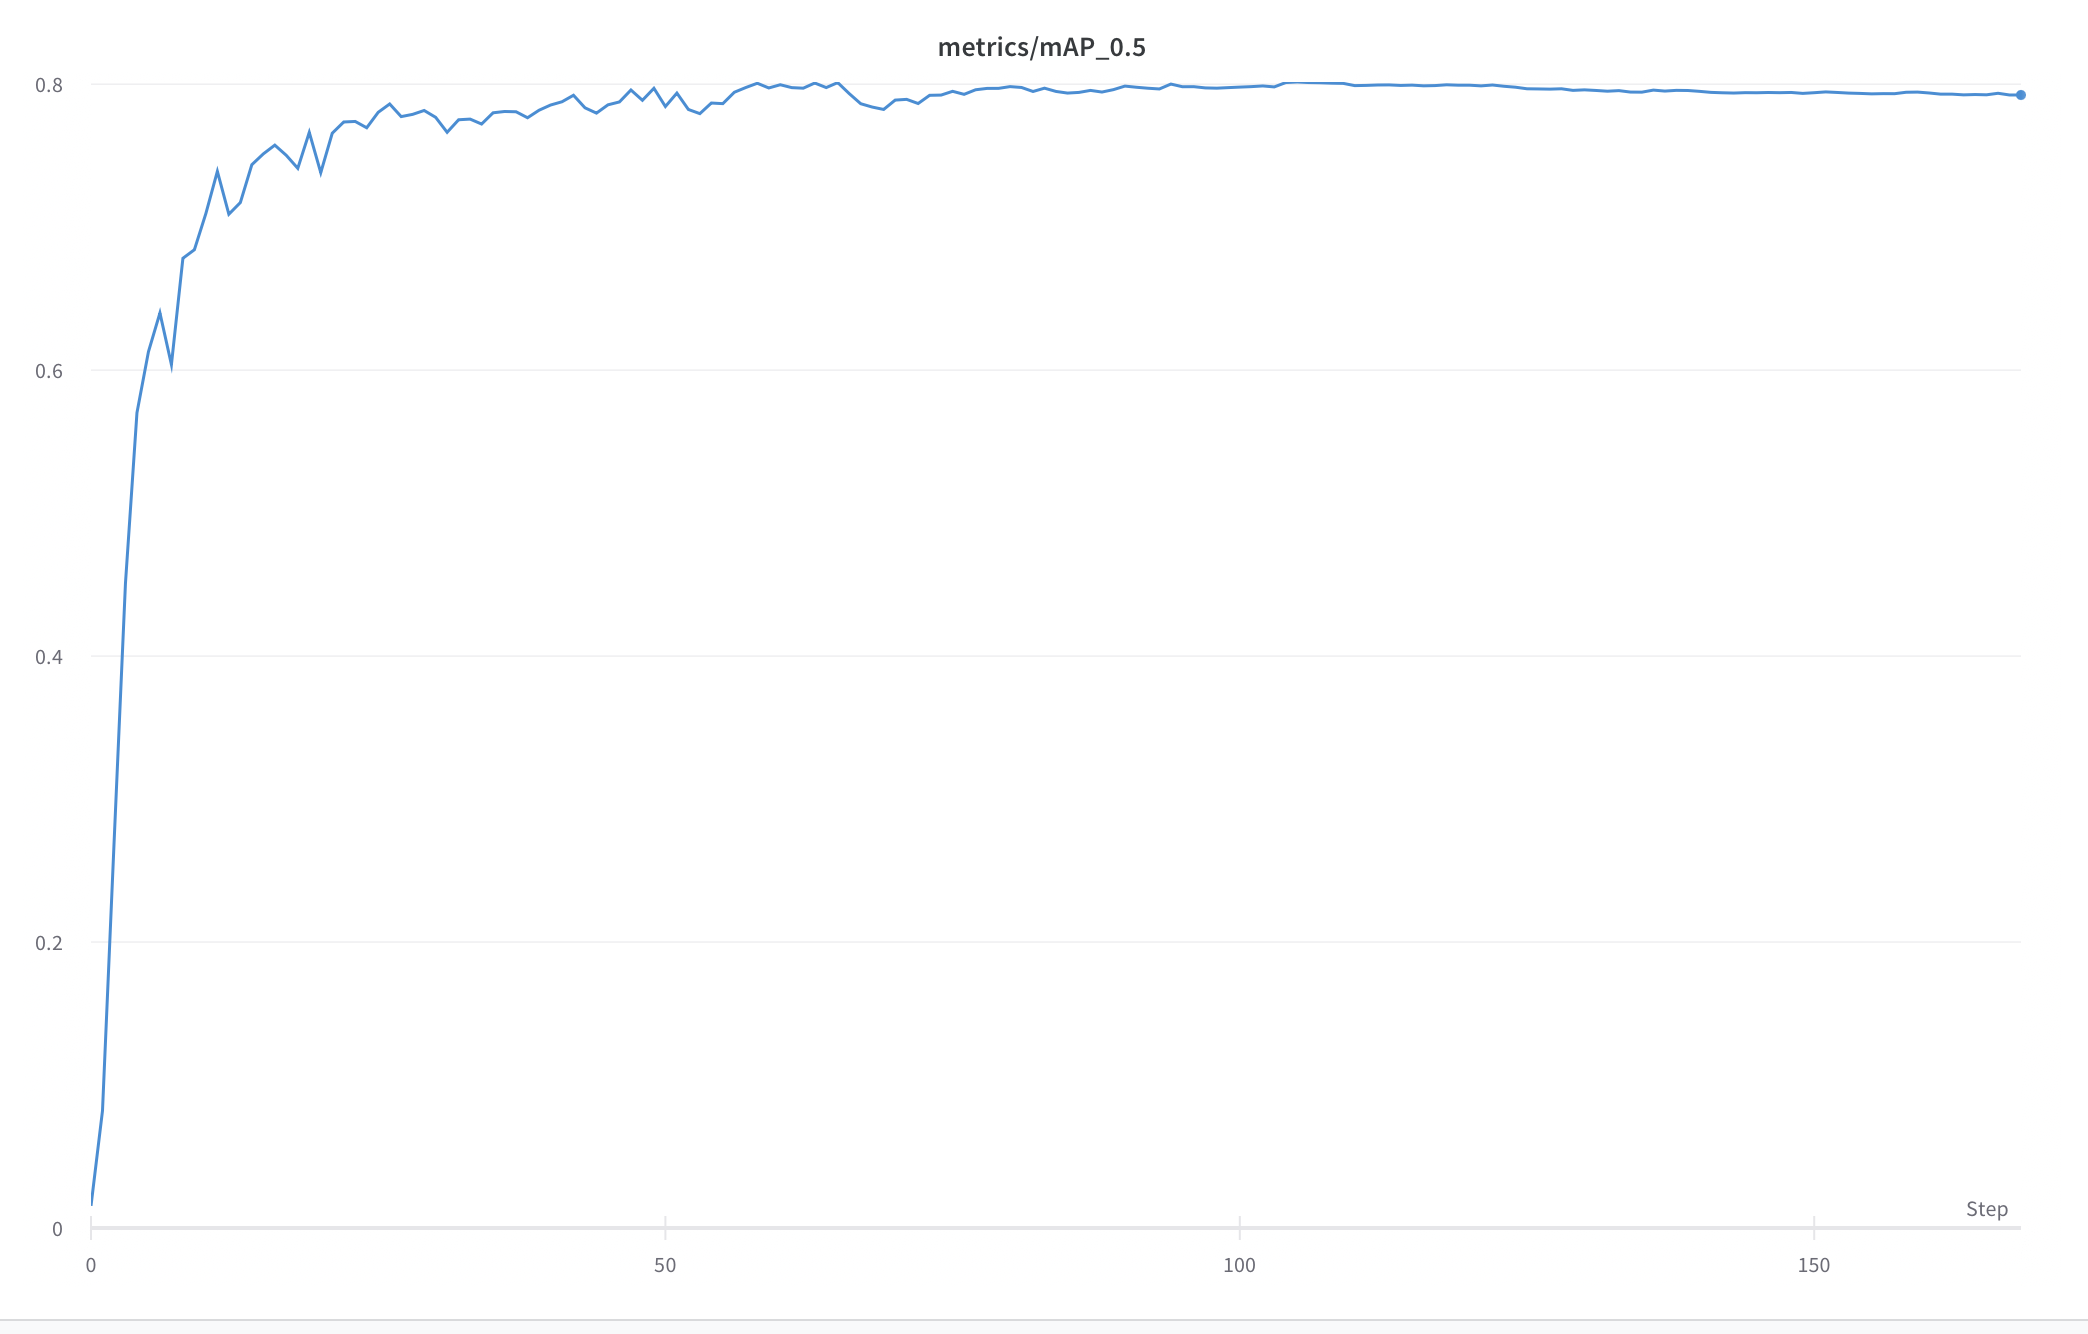
Fig. 42 mAP@0.5 Curve for each epoch
Next Steps
Now that we have a trained model we’re ready to perform adversarial attacks and analyze the effect it has on prediction accuracy. For our first attempts we plan to take a simple approach and introduce gaussian and uniform random noise to the images and examine the effect on accuracy.
Going beyond that we hope to perform targeted gradient attacks on the model. Gradient attacks involve making slight adjustments to the back-propogation algorithm to introduce very slight pertubations to the input images and have been shown to have significant effects on image classifiers and object detectors. We hope to observe the minimum change added that will fool our model in three categories.
Objectness(How confident the model is in a prediction)
Classification
Bounding box location/size
In addition to these goals we also plan to work on our stretch goal of making our model more robust against these attacks. We’re working on performing data augmentations to our images to increase the amount of images containing bicycles as this class is underrepresented in our dataset with only 468 observations. We’re hoping that performing augmentations such as horizontal flips and rotations will increase our models prediction accuracy.